Download
1 / 17
170 likes | 284 Views
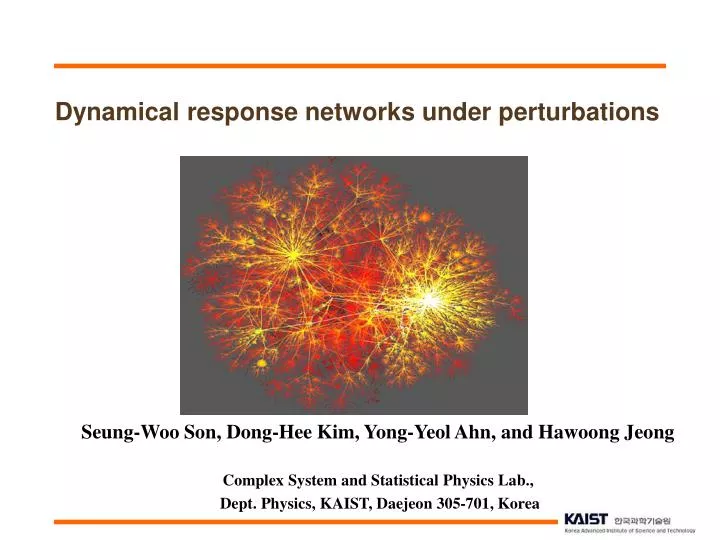
Dynamical response networks under perturbations. Seung-Woo Son, Dong-Hee Kim, Yong-Yeol Ahn, and Hawoong Jeong Complex System and Statistical Physics Lab., Dept. Physics, KAIST, Daejeon 305-701, Korea. Motivation : Microarray Data.

E N D
Dynamical response networks under perturbations Seung-Woo Son, Dong-Hee Kim, Yong-Yeol Ahn, and Hawoong Jeong Complex System and Statistical Physics Lab., Dept. Physics, KAIST, Daejeon 305-701, Korea
Motivation : Microarray Data • Microarray data show the response of each gene to an experiment, which is a kind of perturbation to the genetic network. • ex) gene deletion, temperature change etc • Like building the genetic network from microarray data, the secondary network can be constructed from the response of primary network under perturbation. • ex) node removal(?) • “ Can the secondary network represents the primary network correctly ? ” • “ What is the meaning of the response under perturbation ? ” • “ Ultimately, can we find out primary network from the secondary network ? ”
Introduction : Node Removal Perturbations • When a node is removed, network structure changes. The network can break into several isolated clusters. • Giant cluster size decreases gradually and the average path length increases. R. Albert and A.-L.Barabási, Reviews of Modern Physics, 74, 47 (2002) • SF network is more tolerant against random removal better than random network. • In SF network, the diameter changes under a node removal follow the power-law distributtion. J.-H. Kim, K.-I. Goh, B. Kahng and D. Kim, Physical Review Letters, 91, 5 (2003)
target start target start i j i 1 1 1 1 k k Introduction : Load & Betweenness Centrality • What is the “Load” ? • When every pair of nodes in a network exchanges data packets along the shortest path, load of a node is the total number of data packets passing through that node. • ex) Internet traffic jam j • Betweenness Centrality BC ( Freeman, 1977 ) • if is the number of geodesic paths from i to j and is the number of paths from i to j that pass through k, then is the proportion of geodesic paths from i to j that pass through k. The sum for all i,j pairs is betweenness centrality.
cf) diameter changes Introduction : BC Changes . - BA model J.-H. Kim, K.-I. Goh, B. Kahng and D. Kim, Physical Review Letters, 91, 5 (2003)
distribution is power law distribution with exponent 2.1 • Summation of BC changes after i-th node removal is linearly proportional to BC of i-th node in BA model. Distribution of . - BA model
a 4 3 c 2 b 5 6 1 e d 4 1 7 3 f MST & Percolation Network • How to build the secondary network ? : Based on = “correlation” bewtween node i and j • MST (minimum spanning tree) A graph G = (V,E) with weighted edges. The subset of E of G of minimum weight which forms a tree on V ≡ MST .A node is linked to the most influential one with constraint such that N vertices must be connected only with (N-1) edges. • Percolation After sorting Δbi(j) in descending order, add a link between i and j following that order. When all nodes make a giant cluster, stop the attachment.It means the links with values Δbi(j) > b* (percolation threshold) are valid and connected. MST
Result : Secondary Networks • The degree k of secondary networks contain the global information of primary network, because it is constructed from BC that is calculated from the information of whole network. • More sparse or dense networks which contain the information of original network can be constructed. • Secondary networks represent the primary network well with significant link matches. BA 100 MST Secondary network construction
Result : Minimal Spanning Tree • In MST network, the degree distribution shows the power-law with exponent 2.2 not 3.0 ( Scale-free ) • The degree of each node in secondary network is linearly correlated to that of primary network.
Result : Percolation Network • The degree distribution of percolation network shows power-law. ( exponent -1.9 ) • Percolation features appear during giant cluster fromation.
1 1 compare 6 6 2 2 3 0 3 0 5 4 5 4 Similarity Measurement between Two Networks • The links of each node are regarded as vector in N dimensional vector space. • Vector inner product shows the similarity between two networks. • Binary undirected network case : It means how many links are overlapping each other. • The network similarity measure between secondary and primary networks are significantly higher than other network. • ( MST : 90.8 % , percolation : 76.6 % ) • The secondary networks well represent the primary network.
Conclusions & Future Works • Conclusions • Two secondary networks, MST & percolation network, reproduce the scale-free behavior and its degree of each node is in proportion to degree of primary network. Its degree contains the global information of primary network. • Similarity measurement shows that the secondary networks reproduce original network quite well. ( MST: 91% , percolation: 77% ) • BC change Δbi(j) values represent the interaction between i-node and j-node. And It is related to diameter change directly. • Δbi(j) and b(i) relations might help to explain network classification with BC distribution exponents. • Future Works • BC change calculation for other network models and real networks. • Precise relation between Δbi(j) and b(i) , analytic calculation. • Finding primary network from secondary network information.
start D B A G E C F Distribution of BC Changes . bi : summation of BC after i-th node removed bo : summation of BC over whole network. bκ : summation of BC from κ-th node to all.
Distribution of BC Changes . Δbi : ( i-th node removed ) summation of BC changes. 1 Network deformation = select alternative shortest path + detour ( Contribution to Δbi> 0 ) 2 Lost a source of BC = ( Contribution to Δbi< 0 ) 77.4% Contribution of Δbi = portion of b(i) select alternative shortest path + detour Nonlinear! 22.6%
Distribution of BC Changes . • Small closeness centrality of A • Large sum of distance from A • Large ② contribution and small network deformation : A A Network B : B • Large closeness centrality of B • small sum of distance from B • small ② contribution and large network deformation ( λ: detour length )
Next One? 0 6 2 1 4 3 5 Introduction : Scale-free network • What is the Scale Free Network? • SF network is the network with the power-law degree distribution. Ex) BA modelgrowth and preferential attachmentA.-L.Barabási and R. Albert, Emergence of scaling in random networks, Science, 286, 509 (1999) • Ex) Empirical Results of Real NetworksWorld-Wide Web, Internet, Movie actor collaboration network, Science collaboration graph, Cellular network, etc.R. Albert, H. Jeong, and A.-L.Barabási, Nature(London), 406, 378 (2000) • SF network shows error and attack tolerance.
start D B A G E C F Introduction : Load & Classification of networks • What is the “Load” ? • When every pair of nodes in a network exchanges data packets along the shortest path, load, or “betweenness centrality(BC),” of a node is the total number of data packets passing through that node. Ex) Internet traffic jam, influential people in social network, etc. δ is universal value ! • “It is found that the load distribution follows a power-law with the exponent δ~2.2(1)”K.-I. Goh, B. Kahng, and D. Kim, Universal Behavior of Load Distribution in Scale-Free Networks, PRL, 87, 27 (2001) • The exponent of load is robust without network model dependency. It can be used to classify the networks. • Kwang-Il Goh, et al., Classification of scale-free networks, PNAS, 99, 20 (2002)