Download
1 / 24
250 likes | 464 Views
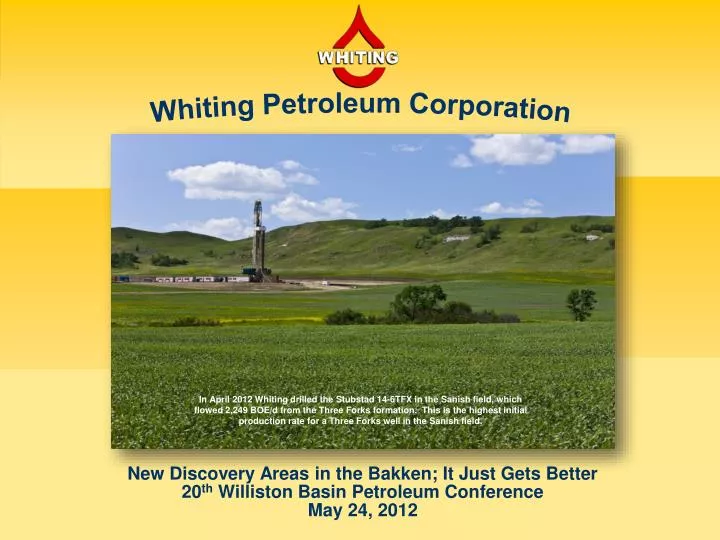
Whiting Petroleum Corporation. In April 2012 Whiting drilled the Stubstad 14-6TFX in the Sanish field, which flowed 2,249 BOE/d from the Three Forks formation. This is the highest initial production rate for a Three Forks well in the Sanish field.

E N D
Whiting Petroleum Corporation In April 2012 Whiting drilled the Stubstad 14-6TFX in the Sanish field, which flowed 2,249 BOE/d from the Three Forks formation. This is the highest initial production rate for a Three Forks well in the Sanish field. New Discovery Areas in the Bakken; It Just Gets Better 20th Williston Basin Petroleum Conference May 24, 2012
Forward-Looking Statements, Non-GAAP Measures, Reserve and Resource Information, Definition of De-Risked This presentation includes forward-looking statements that the Company believes to be forward-looking statements within the meaning of the Private Securities Litigation Reform Act of 1995. All statements other than statements of historical fact included in this presentation are forward-looking statements. These forward looking statements are subject to risks, uncertainties, assumptions and other factors, many of which are beyond the control of the Company. Important factors that could cause actual results to differ materially from those expressed or implied by the forward-looking statements include the Company’s business strategy, financial strategy, oil and natural gas prices, production, reserves and resources, impacts from the global recession and tight credit markets, the impacts of state and federal laws, the impacts of hedging on our results of operations, level of success in exploitation, exploration, development and production activities, uncertainty regarding the Company’s future operating results and plans, objectives, expectations and intentions and other factors described in the Company’s Annual Report on Form 10-K for the year ended December 31, 2011. Whiting’s production forecasts and expectations for future periods are dependent upon many assumptions, including estimates of production decline rates from existing wells and the undertaking and outcome of future drilling activity, which may be affected by significant commodity price declines or drilling cost increases. In this presentation, we refer to Adjusted Net Income and Discretionary Cash Flow, which are non-GAAP measures that the Company believes are helpful in evaluating the performance of its business. A reconciliation of Adjusted Net Income and Discretionary Cash Flow to the relevant GAAP measures can be found at the end of the presentation. Whiting uses in this presentation the terms proved, probable and possible reserves. Proved reserves are reserves which, by analysis of geoscience and engineering data, can be estimated with reasonable certainty to be economically producible from a given date forward from known reservoirs under existing economic conditions, operating methods and government regulations prior to the time at which contracts providing the right to operate expire, unless evidence indicates that renewal is reasonably certain. Probable reserves are reserves that are less certain to be recovered than proved reserves, but which, together with proved reserves, are as likely as not to be recovered. Possible reserves are reserves that are less certain to be recovered than probable reserves. Estimates of probable and possible reserves which may potentially be recoverable through additional drilling or recovery techniques are by nature more uncertain than estimates of proved reserves and accordingly are subject to substantially greater risk of not actually being realized by the Company. Whiting uses in this presentation the term “total resources,” which consists of contingent and prospective resources, which SEC rules prohibit in filings of U.S. registrants. Contingent resources are resources that are potentially recoverable but not yet considered mature enough for commercial development due to technological or business hurdles. For contingent resources to move into the reserves category, the key conditions, or contingencies, that prevented commercial development must be clarified and removed. Prospective resources are estimated volumes associated with undiscovered accumulations. These represent quantities of petroleum which are estimated to be potentially recoverable from oil and gas deposits identified on the basis of indirect evidence but which have not yet been drilled. This class represents a higher risk than contingent resources since the risk of discovery is also added. For prospective resources to become classified as contingent resources, hydrocarbons must be discovered, the accumulations must be further evaluated and an estimate of quantities that would be recoverable under appropriate development projects prepared. Estimates of resources are by nature more uncertain than reserves and accordingly are subject to substantially greater risk of not actually being realized by the Company.
Whiting Overview Q1 2012 Production 80.7 MBOE/d Proved Reserves(1)345.2 MMBOE % Oil 86% R/P ratio(2)14 years Drilling the Hutchins Stock Association #1096 in North Ward Estes Field, Whiting’s EOR project in Ward and Winkler Counties, Texas. Whiting reserves at December 31, 2011 based on independent engineering. R/P ratio based on year-end 2011 proved reserves and 2011 production.
Map of Operations ROCKY MOUNTAINS 54.0 MBOE/D Q1 2012 Net Production 80.7 MBOE/d MICHIGAN 2.7 MBOE/D MID-CONTINENT 8.7 MBOE/D PERMIAN 13.6 MBOE/D GULF COAST 1.7 MBOE/D
Platform for Continued Growth (1) 345.2 MMBOE Proved Reserves (12/31/2011) • 86% Oil / 14% Natural Gas Whiting reserves at December 31, 2011 based on independent engineering.
Whiting Pre-Tax PV10% Values at December 31, 2011 (1) - Using SEC NYMEX of $96.19/Bbland $4.12/McfHeld Flat Oil and gas reserve quantities and related discounted future net cash flows have been derived from oil and gas prices calculated using an average of the first-day-of-the month NYMEX price for each month within the 12 months ended December 31, 2011, pursuant to current SEC and FASB guidelines. The NYMEX prices used were $96.19/Bbl and $4.12/MMBtu. Oil includes natural gas liquids. Pre-tax PV10% may be considered a non-GAAP financial measure as defined by the SEC and is derived from the standardized measure of discounted future net cash flows, which is the most directly comparable US GAAP financial measure. Pre-tax PV10% is computed on the same basis as the standardized measure of discounted future net cash flows but without deducting future income taxes. As of December 31, 2011, our discounted future income taxes were $2,132.2 million and our standardized measure of after-tax discounted future net cash flows was $5,272.5 million. We believe pre-tax PV10% is a useful measure for investors for evaluating the relative monetary significance of our oil and natural gas properties. We further believe investors may utilize our pre-tax PV10% as a basis for comparison of the relative size and value of our proved reserves to other companies because many factors that are unique to each individual company impact the amount of future income taxes to be paid. Our management uses this measure when assessing the potential return on investment related to our oil and gas properties and acquisitions. However, pre-tax PV10% is not a substitute for the standardized measure of discounted future net cash flows. Our pre-tax PV10% and the standardized measure of discounted future net cash flows do not purport to present the fair value of our proved oil and natural gas reserves. Other consists of Mid-Continent, Michigan, and Gulf Coast.
Whiting Pre-Tax PV10% Values at December 31, 2011 (1) - Using SEC NYMEX of $96.19/Bbland $4.12/McfHeld Flat Oil and gas reserve quantities and related discounted future net cash flows have been derived from oil and gas prices calculated using an average of the first-day-of-the month NYMEX price for each month within the 12 months ended December 31, 2011, pursuant to SEC and FASB guidelines. The NYMEX prices used were $96.19/Bbl and $4.12/MMBtu. Oil includes natural gas liquids. Pre-tax PV10% amounts above represent the present value of estimated future revenues to be generated from the production of probable or possible reserves, calculated net of estimated lease operating expenses, production taxes and future development costs, using costs as of the date of estimation without future escalation and using 12-month average prices, without giving effect to non-property related expenses such as general and administrative expenses, debt service and depreciation, depletion and amortization, or future income taxes and discounted using an annual discount rate of 10%. With respect to pre-tax PV10% amounts for probable or possible reserves, there do not exist any directly comparable US GAAP measures, and such amounts do not purport to present the fair value of our probable and possible reserves. Other consists of Mid-Continent, Michigan, and Gulf Coast.
Whiting Pre-Tax PV10% Values at December 31, 2011 (1) - Using SEC NYMEX of $96.19/Bbland $4.12/McfHeld Flat Oil and gas reserve quantities and related discounted future net cash flows have been derived from oil and gas prices calculated using an average of the first-day-of-the month NYMEX price for each month within the 12 months ended December 31, 2011, pursuant to SEC and FASB guidelines. The NYMEX prices used were $96.19/Bbl and $4.12/MMBtu. Oil includes natural gas liquids. Pre-tax PV10% amounts above represent the present value of estimated future revenues to be generated from the production of resource potential reserves, calculated net of estimated lease operating expenses, production taxes and future development costs, using costs as of the date of estimation without future escalation and using 12-month average prices, without giving effect to non-property related expenses such as general and administrative expenses, debt service and depreciation, depletion and amortization, or future income taxes and discounted using an annual discount rate of 10%. With respect to pre-tax PV10% values of resource potential reserves, there do not exist any directly comparable US GAAP measures and such amounts do not purport to present the fair value of our resource potential reserves. Resource potential of 148 MMBOE from the ROZ in the North Ward Estes field not reflected in this table as we await results from our initial pilot expected by year-end 2012. Other consists of Mid-Continent, Michigan, and Gulf Coast.
Future Drilling Locations as of December 31, 2011(1) • Please refer to the beginning of this presentation for disclosures regarding “Forward Looking Statements” and “Reserve and Resource Information”. • Includes 203 gross (108 net) PUD locations.
Capital Budget for Key Development Areas in 2012 ($ in millions) These multi-year CO2 projects involve many re-entries, workovers and conversions. Therefore, they are budgeted on a project basis not a well basis. Comprised primarily of exploration salaries, lease delay rentals, seismic, other exploration and development and timing adjustments.
All Whiting Lease Areas In Williston Basin Plays at March 31, 2012 SANISH & PARSHALL A CASSANDRA 1 STARBUCK 2 TARPON 3 MISSOURI BREAKS HIDDEN BENCH 4 LEWIS & CLARK 5 7 6 8 Pronghorn 9 BIG ISLAND 10 A’ As of 03/31/2012, Whiting’s total acreage cost in 701,751 net acres is approximately $336 million, or $479 per net acre.
Whiting Drilling Objectives in the Western Williston Basin -- Shooting for the “Sweet Spots” A A’ Please note dual targets in the Middle Bakken and Pronghorn Sand / Upper Three Forks
Typical Bakken Production ProfilesSanish Field (1) (2) Please refer to the beginning of this presentation for disclosures regarding "Reserve and Resource Information." All volumes shown are un-risked. Our pretax PV10% values do not purport to present the fair value of our oil and natural gas reserves. EURs, ROIs, IRRs and PV10% values will vary well to well. Whiting holds an average WI of 60% and an average NRI of 50% in its operated Bakken wells in Sanish field.
Typical Three Forks Production ProfileSanish Field (1) (2) Please refer to the beginning of this presentation for disclosures regarding "Reserve and Resource Information." All volumes shown are un-risked. Our pre-tax PV10% values do not purport to present the fair value of our oil and natural gas reserves. EURs, ROIs, IRRs and PV10% values will vary well to well. Whiting holds an average WI of 60% and an average NRI of 50% in its operated Three Forks wells in Sanish field.
Typical Non-Sanish Field Bakken or Pronghorn Sand / Three Forks Well Expected Results(1) EUR – 600 MBOE (Avg 1st 30 days 830 BOE/d) EUR – 350 MBOE (Avg1st 30 days 430 BOE/d) Please refer to the beginning of this presentation for disclosures regarding "Reserve and Resource Information." All volumes shown are un-risked. Our pre-tax PV10% values do not purport to present the fair value of our oil and natural gas reserves.
Average IP and 30, 60, 90 Day Production(1) of 2011 Whiting Operated SanishBakken and Pronghorn Wells (1) All wells drilled and completed in the year 2011.
Six Month Cumulative Production by Operator For Bakkenand Three Forks Wells Drilled Since January 2009 & Operators with Greater that 10 Wells Producing Source: IHS Energy, Inc. & North Dakota Industrial Commission (As of April, 2012) 6 month Avg Production
Bakken Sweet Spots Max Average Daily Rate (BOEPD) (Max Month BOE/30.4 Days) (1) > 1000 CASSANDRA > 750 TARPON SANISH > 500 STARBUCK > 250 < 250 PARSHALL Pre 2000 or No Data MISSOURI BREAKS Whiting Prospect Areas HIDDEN BENCH LEWIS & CLARK BIG ISLAND PRONGHORN (1) Data sourced from NDIC & IHS
Porosity Distribution in SEM Data Cube of the Middle Bakken Silt Hidden Bench Prospect, McKenzie County, North Dakota • Sample: • Middle Bakken siltstone in the Chitwood 44-36TFH, Hidden Bench Prospect, McKenzie County, North Dakota • Reservoir Properties: • Porosity = 4.0% • Permeability = 60 micro-darcies • Sweet spot 10 – 100 md • Total HC Saturation = 61.3% • Description: • Well-connected, inter-granular, slot pores along matrix grain boundaries • 3D image generated from dual-beam, scanning electron microscope in Whiting’s Rock Lab in Denver, Colorado 10microns
Whiting Rock Lab High Resolution Reservoir Characterization Core Layout Facility • Logging / Calibration • Sample Selection • Collaboration & Training Reservoir Characterization • In-house Facility • Operated + Non-op Core • Collaboration & Training • Over 150 Cores Reviewed Environmental SEM / Qemscan • Micron-scale Resolution • Rapid Analysis • Alter Atmospheric Conditions Mineral Model • Quantitative Mineral Composition & Abundance • Petrophysical Calibration • Accurate Log Analysis Electron Beam Gallium Beam 3-D Textural Model • Kerogen Volume & Distribution • Porosity Volume & Distribution • Detailed pore throat geometry and size • Reservoir Pre-qualification Dual Beam SEM • Nanometer-scale Resolution • Dual Beam Technology -Gallium Beam Milling (Slices) -Electron Beam Scanning (Photo) 1 Micron
SanishField Area Gathering System & Robinson Lake Gas Plant SANISH FIELD
Pronghorn Field Area Gathering System& Belfield Gas Plant Pronghorn Field
Consistently Strong Margins Consistently Delivering Strong EBITDA Margins (1) $90.51/Bbl $3.43/Mcf $74.17/BOE $69.06 $73.88 $61.48 $53.57 $50.52 $45.01 $44.70 Whiting Realized Prices(1) $/BOE (1) Includes hedging adjustments.
In Summary (1)Percent oil reserves and R/P ratio based on year-end 2011 proved reserves and total 2011 production.