Download
1 / 13
130 likes | 232 Views

E N D
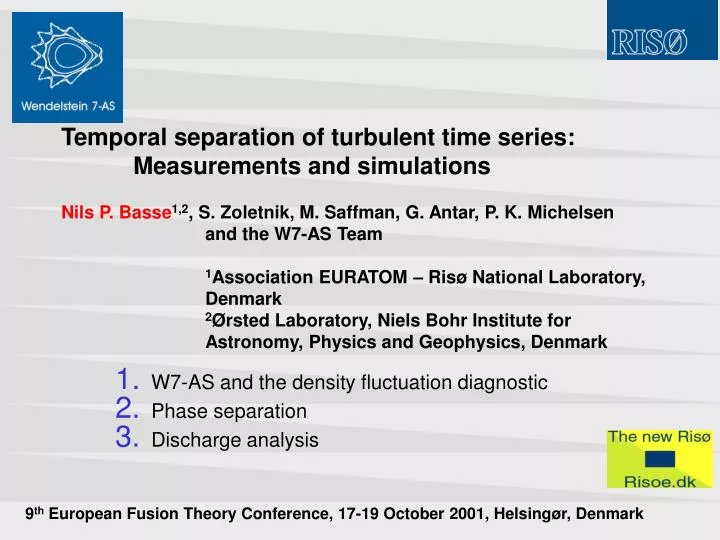
Temporal separation of turbulent time series: Measurements and simulationsNils P. Basse1,2, S. Zoletnik, M. Saffman, G. Antar, P. K. Michelsen and the W7-AS Team1Association EURATOM – Risø National Laboratory, Denmark2Ørsted Laboratory, Niels Bohr Institute for Astronomy, Physics and Geophysics, Denmark W7-AS and the density fluctuation diagnostic Phase separation Discharge analysis 9th European Fusion Theory Conference, 17-19 October 2001, Helsingør, Denmark
The density fluctuation diagnostic • Diagnostic installed on the Wendelstein 7-AS (W7-AS) stellarator • Small angle collective scattering of infrared light (radiation source is a CO2 laser) • Heterodyne, dual volume system (only 1 volume shown for clarity) • Wavenumber analysed here is 14 cm-1 (range is from 14 to 62 cm-1) • M. Saffman et al., Rev. Sci. Instrum. 72 (2001) 2579
The density fluctuation diagnostic • Diagnostic installed on the Wendelstein 7-AS (W7-AS) stellarator • Small angle collective scattering of infrared light (radiation source is a CO2 laser) • Heterodyne, dual volume system (only 1 volume shown for clarity) • Wavenumber analysed here is 14 cm-1 (range is from 14 to 62 cm-1) • M. Saffman et al., Rev. Sci. Instrum. 72 (2001) 2579
Phase separation theory The observed signal consists of counter propagating electron bunches. The light scattering signal I can be written I(t) = aj exp(ij) = A exp(i), where Nb is the number of bunches, while aj and j is the amplitude and phase of bunch number j, respectively. The measured complex signal can be written S = X + iY = A exp(i), where = kU t. The time derivative of the phase is t = [XtY - YtX] / A2 Nb j=1 G. Antar et al., Plasma Phys. Control. Fusion 41 (1999) 733
Simulated signal Simulated events are complex signals having a finite length and a Gaussian time evolution of the amplitude.
Phase separation tests The quality of the phase separation technique is gauged by cross correlating the simulated and separated amplitudes. A variety of parameters can be adjusted: • Phase velocity • Noise level • Number/lifetime/amplitude of events
Discharge overview Right-hand figure: Autopower spectra from a W7-AS shot displaying three distinct phases: • L-mode 100-400 ms • Dithering H-mode 400-550 ms • ELM-free H-mode 550-600 ms Left-hand figure: Autopower spectra from a DIII-D discharge. C. L. Rettig et al., Phys. Plasmas 4 (1997) 4009
Discharge overview Run-of-the-mill L-H switching:
Events in L- and H-mode The 3 figures below show the amplitude (top) and phase derivative (bottom) for time windows of 100 s. H-mode L-mode Background The raw data has been bandpass filtered between 1 kHz and 1 MHz before the amplitude and phase derivative was calculated.
Average derivative Averaging the absolute value of the phase derivative over 100 s time windows, a clear correlation is seen with the dithering in other plasma parameters such as the H-light. This is not the case for the standard average – work is in progress.
Conclusions and outlook We have in this presentation outlined an investigation dealing with time derivatives of the phase of our signal: • The procedure as first used by G. Antar et al. on Tore Supra data is applicable to W7-AS discharges • Simulations creating autopower spectra similar to those measured have shown that phase separation of events in counter propagating directions is a valid approach • Events in L- and H-mode time windows have distinguishable phase derivatives Outlook: • Continue search for quantities differing in L- and H-mode (e.g. tt, PDF’s), work on bandpass filtering and physics interpretation • Use the technique for calculating phase separated autopower spectra in L- and H-modes Completed work and ongoing studies:www.npb.dk
MAY 2001:Detachment in W7-AS divertor plasmas • First modular stellarator divertor (10 discrete toroidal sections) is operating in W7-AS • 2 MW NBI power, a = 0.556 • Two density plateaus (we have obtained densities of 41020 m-3) • Strictly speaking the discharge was partially detached, strike points still visible (thermography, H) • Observed wavenumber 20 cm-1 • Spectra broaden at detachment • Frequency integrated fluctuations increase at detachment