Download
1 / 18
180 likes | 240 Views
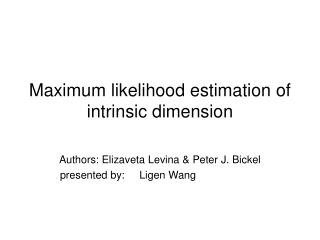
Maximum likelihood estimation of relative transcript abundances. Advanced bioinformatics 2012. Fish population. P b. P r. Fish population.

E N D
Maximum likelihood estimation of relative transcript abundances Advanced bioinformatics 2012
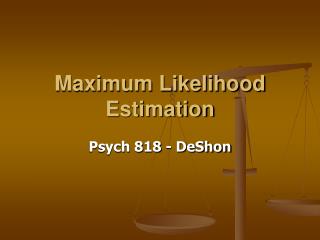
Fish population Pb Pr
Fish population • We want to use our observation which is our catch (1 red and 3 blue fish ) to estimate the concentration of red (Pr) and blue (Pb ) fish in the pond. • In other words: we search for a Pr and Pb that gives the highest (Maximum) probability (likelihood) of catching exactly 1 red and 3 blue fish. • To accomplish that we need a function/model which we can use to determine the probability of catching exactly 1 red and 3 blue fish when the concentrations of blue and red fish in the pond are Pb and Pr, respectively.
Catch sequence &likelihood function Likelihood function
Fish population We can determine the population structure by searching for the parameters Pr and Pb that maximize the likelihood of fishing 3 blue and 1 red fish. (According to our model). • Question: For which parameter combination do I have the highest probability of catching exactly 1 red and 3 blue fish. • Make a perl function (1) that returns the likelihood of fishing 3 blue and 1 red fish given a Pr and Pb. • Calculate the likelihood for Pr [0.01, 0.99] and Pb (0.01..0.99). Rember that Pr + Pb = 1. Hint: do the actual loop from 1 to 99 and only divide by 100 when you cal l the likelihood function • Find the combination of Pr and Pb values that give highest likelihood of fishing 1 red and 3 blue fish. • If have you time left make a plot of Pr against the likelihood in R.
Fish Population When Pr = 0.25 and Pb = 0.75 (1-Pr), you have the highest Probability of catching 1 red and 3 blue fish. (Maximum likelihood estimation)
What has this fishing experiment to do with transcriptome sequencing. • On the first instance quite a lot ! • Lets simply replace pond with fish by an tube containing a mixture of mRNA molecules. • Next, we can roughly replace “fishing” by “sequencing”. • Finally we replace the “catch” with our “mapped reads”. Sequencing Unknown Transcript population Mapped reads (Catch)
Main question • What are the relative abundances of the transcripts in our sample. • We have to estimate these relative abundances using: • the read alignments. • Transcript structure knowledge
Is there any difference between sequencing and fishing • Usually with fishing you catch whole fish • With current technology, you can only get high throughput for short reads. • These reads represent transcript fragments not only derived different genes but also different AS isoforms. • Hence, it is like performing the fishing in a pond with fish fragments instead of entire fish.
What does the likelihood function calculate for mRNA seq experiments The likelihood of observing this specific set of reads (R) given a specific distribution of transcript abundances in the sample. The function is: the product of the probabilities of observing each of the individual reads (rj) (Given a particular transcript abundance distribution).
Probability of observing a specific read (I) The probability of observing a specific read is the sum of the probabilities that the Read has originated from the individual transcripts in the sample • Components • The fact (Kjt) that a read j is compatible with the transcript t or not. Kjt is either 1 or 0. • The probability of selecting a read that originates from a specific transcript: • Corresponds to the fraction of reads in the read pool that originate from the transcript. • The product of the relative abundance- (at) and the effective length of the transcript (lt) Transcript read lt
Probability of observing a specific read (II) 2. The probability that a read originates exactly from a certain position on transcript t. Without positional bias this probability is uniform along the sequence thus: 1 / lt
Probability of observing a specific read (III) Probability of selecting the Read from the read pool Probability of originating From a specific position on the transcript Does read j map to transcript t
Why the summation AS isoforms The probability of observing a read that maps to multiple transcripts is obtained by summing the probabilities of the read mapping to each of the individual transcripts.
Probability of observing the entire set of reads (R) Product of the probabilities for observing each individual read.
Log likelihood Large numbers of consecutive multiplications of probabilities (0..1) are a computational difficulty. A good solution is to replace the multiplication of the probabilities by a summation of the logarithm of the probabilities.
Assignment Relative abundances AS Isoforms T1 a1 Single isoform gene T2 a2 T3 a3 Important rule: a1 + a2 + a3= 1
Assignment • You will get a file that represents a compatibility matrix. • Each line has 3 values such as 1 1 0 (indicating that the read maps to transcript 0 and 1 but not 2. • A part of the code is already filled in. • Build the missing functions for the program and estimate the abundances of the 3 transcripts.