Download
1 / 26
280 likes | 396 Views
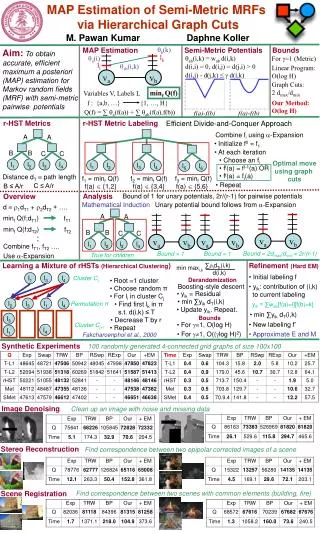
Joint Detection-Estimation of Brain Activity in fMRI using Graph Cuts. Joana Maria Rosado da Silva Coelho. Thesis for the Master degree in Biomedical Engineering Lisbon, 30 th October 2008. Contents:. functional MRI:.

E N D
Joint Detection-Estimation of Brain Activity in fMRI using Graph Cuts Joana Maria Rosado da Silva Coelho Thesis for the Master degree in Biomedical Engineering Lisbon, 30th October 2008
functional MRI: fMRI technique aims at identifying cerebral areas (Brain Mapping) that were activated by an external stimulus – paradigm. Classical tasks to induce neuronal responses: visual activation (looking at changing patterns); sensorimotor activation (sequence of defined finger movements). This modality is based on the assumption that activated regions present increased metabolic activity.
fMRI-BOLD Baseline Activation • The higher proportion of hemoglobin molecules bound with oxygen (oxyhemoglobin) is observed as a signal increase on T2*- weighted images (increase in the BOLD signal). • BOLD signal does not measure brain function directly.
Hemodynamic Response Function • After a stimulus application there is a local hemodynamic change in capillaries and draining veins. • This vascular response can be modeled by an hemodynamic response function.
Type of Data: Diagram of a typical fMRI data set.
Type of Data: Example of a time course from a visual stimulation experiment.
SPM-GLM Classical method: - Statistical parametric mapping (SPM) commonly based on GLM - 2 steps algorithm: Estimation and Inference - Inference step needs the tuning of the p-value
Objectives: Detect activated regions Estimate the hemodynamic response function (HRF) Statistical Model: SPM-Drift-GC Model spatial correlation Incorporate the drift removal
Proposed Model: ? Neuro-Hemodynamic System Stimuli BOLD Signal
Bayesian Approach – MAP criterion The Maximum a Posteriori (MAP) estimation is obtained by computing where Prior Term Data Fidelity Term
Algorithm • For each voxel, the estimation of bi, hi and di is performed iteratively. • h0is a gamma function as proposed by • Friston et al in 1998 which provides a physiological reasonable waveform to the HRF.
Spatial correlation step The final step models spatial correlation. Since different tasks activate different brain regions, it is less probable that non-activated voxels appear inside of an activated region and the converse is also true. Avoids misclassification inside activated regions. Energy function: Dp – cost of attributing the label to the pixel p Vh,v – cost of attributing the labels , to the N neighbour pixels
Results – Synthetic data SPM-Drift SPM-Drift-GC
Results – Synthetic data Example of an SNR=2 dB time course with the real and estimated drift.
Results – Real data Reference result SPM-GLM SPM-GC-Drift Motor task – Right foot Loose result SPM-GLM Restrict result SPM-GLM
Results – Real data Reference result SPM-GLM SPM-GC-Drift Verb generation task Loose result SPM-GLM Restrict result SPM-GLM
Results – Real data Reference result SPM-GLM SPM-GC-Drift Motor task – Tongue Loose result SPM-GLM Restrict result SPM-GLM
Results – Real data Reference result SPM-GLM SPM-GC-Drift Verb generation task Loose result SPM-GLM Restrict result SPM-GLM
Conclusions TheBayesianframeworkcombinedwithGraphCutsalgorithmimproves the sensitivity in the detection of activated areas. The proposed algorithm does not require the tuning of any parameter by the clinician. The beta coefficients are considered to be binary. SPM-GC-Drift leads to similar results as the ones obtained by SPM-GLM. However, other brain activated regions were also detected which requires future analysis.
Conclusions Thepresentworkhasbeenpublished 30th AnnualInternational IEEE EMBS Conferencein Vancouver, BritishColumbia, Canada RecPad2008 – 14ª Conferência Portuguesa de Reconhecimento de Padrões … andsubmitted HumanBrainMappinginternationaljournal Thankyouforyourattention!!!