Download
1 / 40
400 likes | 492 Views
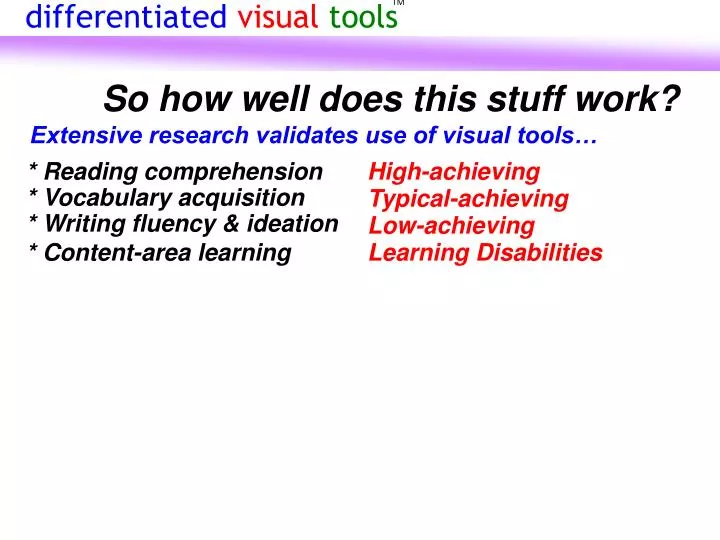
differentiated visual tools. TM. So how well does this stuff work?. Extensive research validates use of visual tools…. * Reading comprehension. High-achieving. * Vocabulary acquisition. Typical-achieving. * Writing fluency & ideation. Low-achieving. * Content-area learning.

E N D
differentiated visual tools TM So how well does this stuff work? Extensive research validates use of visual tools… * Reading comprehension High-achieving * Vocabulary acquisition Typical-achieving * Writing fluency & ideation Low-achieving * Content-area learning Learning Disabilities
differentiated visual tools TM Large N quantitative studies (true- & quasi-experimental designs) Qualitative studies Program Evaluations Typical measures include… General performance on high-stakes tests Performance in specific skills (writing) and vocabulary Depth / Breadth / Accuracy of new content knowledge Social validity (teacher & student satisfaction) Fidelity & factors that affect it For example….
differentiated visual tools TM American History WEEK 1 WEEK 2 Teaches 2nd mini-unit using Teacher A Teaches 1st mini-unit using traditional guided note-taking / discussion instruction Teaches same 1st mini-unit using Teacher B Teaches same 2nd mini-unit using traditional guided note-taking / discussion instruction 32 High Achieving 32 Typical Achieving 32 Low Achieving 16 Students w/LD Changes in students’ knowledge about the mini-unit topic are measured at end of each mini-unit
differentiated visual tools TM HA This allowed us to establish the “high water” line. TM American History First, we measured how much newknowledge of history High Achieving students typically gain when teachers use traditional content instruction methods. Text-based, guided note-taking / class discussion
differentiated visual tools TM HA HA HA 21% more Gap between High & Typical Achievers TA American History High Achieving students tend to gain 21% more knowledge than do Typical Achieving students from the same lesson. This allowed us to establish the “typical amount” line. Then, we measured how much new knowledge of history Typical Achieving students usually gain when teachers use traditional content instruction methods.
differentiated visual tools TM HA HA HA 29% more Gap between Typical & Low Achievers TA LA American History Typical-achievers typically gain 29% more knowledge from a traditional lesson than do Low Achievers. Then, we measured how much new knowledge of history Low Achieving students typically gain.
differentiated visual tools TM HA HA HA 27% more Gap between Typical & Students with LD TA LD LA American History Typical-achievers typically gain 27% more knowledge from a traditional lesson than do students with LD. Then, we measured how much new knowledge of history students with LD typically gain from the same ”traditional” lesson.
differentiated visual tools TM HA HA HA TA LD LA American History So now we know what to expect in terms of differences in gains in knowledge about a topic among different types of students when business-as-usual teaching techniques are used on the same history lessons.
differentiated visual tools TM HA HA HA 4 % less TA American History When DVTs is used, Typical Achievers increase their learning to within 4% of what High Achievers learned when traditional instruction is used.
differentiated visual tools TM HA HA HA 4 % less TA 9 % less LA American History When DVTsis used, Low Achievers increase their learning to within 9% of what Typical Achievers learned when traditional instruction is used.
differentiated visual tools TM HA HA HA TA 11 % less LD LA American History When DVTsis used, Students with LD increase their learning to within 11% of what Typical Achievers learned when traditional instruction is used.
differentiated visual tools TM HA HA HA 4 % less TA 9 % less 11 % less LD LA American History At first glance, it seems like DVTsis a powerful tool for “reducing the achievement gap.” The reality is that ALL students greatly enhanced their knowledge when teachers used DVTs
differentiated visual tools TM HA HA HA TA LD LA …and even get wider! American History So the effects of DVTs on the “gap” is to “raise the bar…” All students are significantly increasing their knowledge of history… But the gaps remain!
differentiated visual tools TM depth / breadth / accuracy of knowledge This study compared the relative impact of…. Essential Understandings Generative Idea Generic Graphic Organizers VS. VS. VS. …on depth, breadth, and accuracy of new history knowledge Text Resources 96 11th grade students… 32 high-achieving, 32 typical achieving, 16 low-achieving, & 16 low-achieving w/ LD “Business as Usual”
differentiated visual tools TM PHASE 1 PHASE 2 PHASE 3 PHASE 4 CLASS 1 TEXT RESOURCES GENERIC GRAPHIC ORGANIZERS GENERATIVE IDEA ESSENTIAL UNDERSTANDINGS depth / breadth / accuracy of knowledge Teacher employed a different strategy during each phase of instruction.
differentiated visual tools TM PHASE 1 PHASE 2 PHASE 3 PHASE 4 CLASS 1 Pre & Post measures of students’ Breadth of knowledge Depth of knowledge Accuracy of knowledge TEXT RESOURCES GENERIC GRAPHIC ORGANIZERS GENERATIVE IDEA ESSENTIAL UNDERSTANDINGS depth / breadth / accuracy of knowledge Learning measured for each phase
differentiated visual tools TM TM PHASE 1 PHASE 2 PHASE 3 PHASE 4 TEXT RESOURCES TEXT RESOURCES GENERIC GRAPHIC ORGANIZERS GENERIC GRAPHIC ORGANIZERS GENERATIVE IDEA Visual Tools GENERATIVE IDEA ESSENTIAL UNDERSTANDINGS ESSENTIAL UNDERSTANDINGS depth / breadth / accuracy of knowledge CLASS 1 CLASS 2 2nd teacher used same strategies, but in a different order
differentiated visual tools TM PHASE 1 PHASE 2 PHASE 3 PHASE 4 TEXT RESOURCES TEXT RESOURCES TEXT RESOURCES TEXT RESOURCES GENERIC GRAPHIC ORGANIZERS GENERIC GRAPHIC ORGANIZERS GENERIC GRAPHIC ORGANIZERS GENERIC GRAPHIC ORGANIZERS GENERATIVE IDEA Visual Tools GENERATIVE IDEA Visual Tools GENERATIVE IDEA Visual Tools GENERATIVE IDEA Visual Tools ESSENTIAL UNDERSTANDINGS Visual Tools ESSENTIAL UNDERSTANDINGS Visual Tools ESSENTIAL UNDERSTANDINGS Visual Tools ESSENTIAL UNDERSTANDINGS Visual Tools depth / breadth / accuracy of knowledge CLASS 1 CLASS 2 CLASS 3 3rd & 4th teachers used same strategies, also in different orders CLASS 4
differentiated visual tools TM depth / breadth / accuracy of knowledge Analysis of pre- and post-mini-unit student generated concept maps relative to pre-established criterion maps provided 3 scores (Ruiz-Primo, Shavelson & Shultz, 1997): Accuracy of Relational Understanding Score Breadth of Relational Understanding Score Depth of Relational Understanding Score Students orally explained links between the terms & asked to elaborate on concepts relating to the proposition identified. 3 types of oral prompts were provided to encourage elaboration: Prompts to summarize important ideas about the topic Prompts to relate or apply ideas Prompts to think about the idea in a new way (what if…) Each proposition scored 0-3, depending on whether the proposition appeared on the criterion map, whether the student’s explanation was accurate, factually correct and complete, and the degree of elaboration provided.
differentiated visual tools TM High Achieving Typical Achieving Low Achieving Learning Disabilities Generic G.O.s EU GI Text Resources depth / breadth / accuracy of knowledge ANOVA statistical analysis was used to determine the relative impact of each of the four instructional approaches relative to level of student achievement. TM Tukey’s HSD was used for post hoc analysis.
differentiated visual tools TM High Achieving Typical Achieving Low Achieving Learning Disabilities Generic G.O.s EU GI Text Resources depth / breadth / accuracy of knowledge ANOVA of Accuracyof Knowledge Scores by Level of Student Achievement and Form of Instruction TM … no significant differences In other words, if a treatment worked well with one type of student, it worked equally well with the other types (& vice versa). Tukey’s HSD was used for post hoc analysis.
differentiated visual tools TM High Achieving Typical Achieving Low Achieving Learning Disabilities Generic G.O.s EU GI Text Resources depth / breadth / accuracy of knowledge ANOVA of DEPTHof Relational Understanding Scores by Level of Student Achievement and Form of Instruction TM Significant contrasts: Scores Using Scores Using EU Visual Tools > GI Visual Tools EU Visual Tools > Text Resources Generic Gos> Text Resources EU Visual Tools had the greatest impact on all students depth of relational understanding. Tukey’s HSD was used for post hoc analysis.
differentiated visual tools TM High Achieving Typical Achieving Low Achieving Learning Disabilities Generic G.O.s EU GI Text Resources depth / breadth / accuracy of knowledge ANOVA of BREADTHof Relational Understanding Scores by Level of Student Achievement and Form of Instruction TM Significant contrasts: Scores Using Scores Using EU Visual Tools > GI Visual Tools EU Visual Tools > Text Resources Generic Gos> Text Resources EU Visual Tools had the greatest impact on all students depthof relational understanding. Tukey’s HSD was used for post hoc analysis.
Depth, breadth, & accuracy of new 11th grade history knowledge ANOVA of Depth of Relational Understanding Scores by Level of Student Achievement and Form of Instruction Source Sum of Squares dfMean Square F p Level of Ach. (A) 7990.415 2 3995.207 159.078 .000 Form of Inst. (B) 740.245 3 246.748 9.825 .000 A X B Interaction 48.095 6 8.016 .319 .927 A X B within error 9041.321 36025.113 Post Hoc Analysis of Depth of Relational Understanding Scores- Tukey’s HSD Significant contrasts: Scores Using Scores Using EU Visual Tools > GI Visual Tools EU Visual Tools > Text Resources Generic GOs > Text Resources Significant differences were found between the 4 techniques relative to students with and without LD. For students with LD, the EU & Generic Graphic Organizershad the greatest impact on their depth of relational understanding. Use of traditional-text-based instruction was the least effective.
Depth, breadth, & accuracy of new 11th grade history knowledge ANOVA of Breadth of Relational Understanding Scores by Level of Student Achievement and Form of Instruction Source Sum of Squares dfMean Square F p Level of Ach. (A) 1481.321 2 740.6607 126.603 .000 Form of Inst. (B) 227.494 3 75.831 12.962 .000 A X B Interaction 7.553 6 1.259 .215 .927 A X B within error 9041.321 360 5.850 Post Hoc Analysis of Depth of Relational Understanding Scores- Tukey’s HSD Significant contrasts: Scores Using Scores Using EU Visual Tools > GI Visual Tools EU Visual Tools > Text Resources Generic GOs> GI Visual Tools Generic GOs>Text Resources Significant differences were found between the 4 techniques relative to students with and without LD. EU Visual Tools had the greatest impact on breadth of relational understanding. Use of GI Visual Tools & traditional-text-based instruction were the least effective.
Qualitative analysis of history teachers’ & students perceptions of different types of visual tools * Generic Graphic Organizers * Essential Understanding Visual Tools * Generative Idea Visual Tools * Traditional Guided Note-taking Teachers taught history units employing instruction featuring each of the four instructional approaches. Qualitative data, via semi-structured interviews of teachers and students were collected and analyzed.
Qualitative analysis of history teachers’ & students perceptions of different types of visual tools Emergent themes… Generic Graphic Organizers with embedded prompts about the information structure (hierarchic, compare/contrast, cause/effect, and/or sequence) were perceived as useful by teachers because they helped differentiate the curriculum and organize material. Sample comments: Teacher:“I could use these (Generic GOs) every day. They really help organize the material. When the students used these to take notes, it really helped them see what was important and how things relate” Student: “The(Generic GOs) point to the main topics instead of going into long, long notes. It is better than pages of notes.”
Qualitative analysis of history teachers’ & students perceptions of different types of visual tools Emergent themes… Essential Understanding Both teachers and students perceived that the EU Visual Tools with embedded prompts related to topic-specific essential understandings and prompts to engage in specific information processing skills help make the concepts addressed during the history instruction applicable for the students. Sample comments: Teacher: “These (EU Visual Tools) make the information real and personal to the student. It reminds them that history is interconnected and can even apply to their own lives.” Student: ““These (EU Visual Tools) make it so that you don’t forget what it’s all about. You look at the questions, then the whole topic comes back to you and you say ‘oh yea, I remember that from our notes’.”
Qualitative analysis of history teachers’ & students perceptions of different types of visual tools Generative Idea Teachers and students viewed the Generative Idea Visual Tools somewhat differently. Teachers perceived them as complex and perceived that their students did not understand the “big ideas”. Sample comment: Teacher: “Maybe they would be good for 12th grade second semester students; but my students did not understand these. They did not get the big picture that was trying to be expressed.”
Qualitative analysis of history teachers’ & students perceptions of different types of visual tools • Generative Idea • Teachers’ value of the GI Visual Tools seemed to be impacted by: • The novelty of teaching generative ideas; • Perceived misalignment between generative ideas and what they perceived to be objectives in the state course of study. Sample comments: Teacher: “The concepts in these (GI Visual Tools) were not difficult, they were just new. We’ve never taught anything like this.” Teacher: “I personally don’t have time to teach concepts not on the graduation exam.” Teacher:“They (the students) needed more experience working with these (GI Visual Tools) and these concepts.”
Qualitative analysis of history teachers’ & students perceptions of different types of visual tools Generative Idea Students, however, valued the GI Visual Tools and appreciated the direct instruction in the generative ideas related to a topic. TM Sample comment: Student: “These (GI Smart-sheets) tell you what is important to understand. It spells it right out.”
differentiated visual tools TM 98% 81% 71% 97% PRE PRE POST POST 11th grade students w/LD 11TH grade typical achievers 11thgrade history vocabulary 26 pt gain 17 pt gain
differentiated visual tools TM FLUENCY 117 words Control GroupStudents w/LD Experimental Group Students w/LD Pretest Pretest Post-test Post-test 29 26 words words Writing fluency: 8thgrade students with LD Typical 8th grader N=20 CONTROL group of students w/LD N = 28 EXPERIMENTAL group of students w/LD N = 28 Typical 8th grader produces an average of 117 words on high-stakes essays. 8th students with LD typically produce about 27 words on the same task.
differentiated visual tools TM FLUENCY 126 words +9 words more than typical 8th grader 117 words Pretest Pretest Post-test Post-test 26 29 words words 24 words Writing fluency: 8thgrade students with LD Typical 8th grader N=20 CONTROL group of students w/LD EXPERIMENTAL group of students w/LD Business-as-usual DVTs +97 words more than pretest
differentiated visual tools TM Impact on AYP Writing Assessment % of students meeting or exceeding standards BEFORE schools started implementing DVTs 73.02% before DVTs 58.39% before DVTs 38.83% before DVTs 20.6% before DVTs 9 Schools Extremely low performance 8 Schools Low performance 7 Schools Moderate performance 2 Schools Good performance
differentiated visual tools TM DVTs 82.68% DVTs 74.81% DVTs 62.41% DVTs 49.24% + 28.64pts. + 23.58pts. +16.42pts. +9.66pts. Impact on AYP Writing Assessment % of students meeting or exceeding standards AFTER schools started implementing DVTs 73.02% before DVTs 58.39% before DVTs 38.83% before DVTs 20.6% before DVTs 9 Schools Extremely Low Performing 8 Schools Low Performing 7 Schools Moderate Performing 2 Schools High Performing
differentiated visual tools TM Impact on AYP Writing Assessment So how well do these work? Results consistently show that DVTs … FAR better than “business as usual” (control groups) Significantly better than generic graphic organizers Teachers and students HIGHLY value them
differentiated visual tools TM Semi-rural 5th grade Alabama Writing Assessment % students meeting or exceeding standards Year 1 Year 2 Year 3 Year 4 DVTs implementation Business-as-usual 36.1 51.43 81.0 28.08 School #1 + 23 +30 62.24 22.0 71.0 10.0 School #2 + 52 + 9
differentiated visual tools TM % students meeting or exceeding standards Year 1 Year 2 Non-DVTs High School DVTs High School 51% 51% 53% 77% 26 ptgain 2 pt gain Semi-rural 5th grade Alabama Writing Assessment Both groups performed at the same levels in Year 1 DVTs implementation
differentiated visual tools TM 7thgrade Alabama Writing Assessment % students meeting or exceeding standards Year 1 Year 2 Gains Business-as-Usual DVTs Rural 7th Grade 32.71 57.84 +25.13 61 +23.00 Suburb 7th Grade 38


![Our top 10 B2B email marketing campaigns [and why they work]](https://cdn4.slideserve.com/7375820/slide1-dt.jpg)