Download
1 / 37
370 likes | 500 Views
CHAPTER 3 TEMPERATURE AND ENERGY BALANCE.

E N D
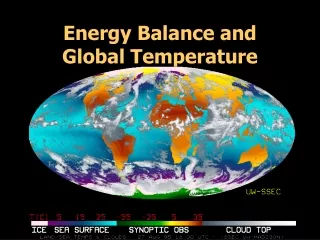
CHAPTER 3 TEMPERATURE AND ENERGY BALANCE
The sky appears blue because gases and particles in the atmosphere scatter some of the incoming solar radiation in all directions. Air molecules scatter shorter wavelengths most effectively. Thus, we perceive blue light, the shortest wavelength of the visible portion of the spectrum.
Sunrises and sunsets appear red because sunlight travels a longer path through the atmosphere. This causes a high amount of scattering to remove shorter wavelengths from the incoming beam radiation. The result is sunlight consisting almost entirely of longer (e.g., red) wavelengths.
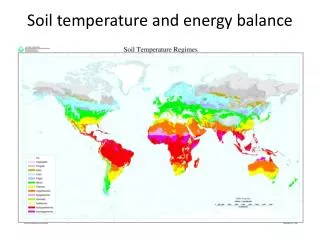
Daily temperature variation • Each day is like a tiny season! • Daytime heating, nighttime cooling • Why do the high and low temperatures happen when they do?
The diurnal cycle of temperature • Daily temperature range near the ground is much greater than that above the ground!
The daily mean is defined as the average of the maximum and minimum temperature for a day. The daily temperature range is obtained by subtracting the minimum temperature from the maximum. The monthly mean temperature is found by summing the daily means and dividing by the number of days in the month. The annual mean temperature is obtained by summing the monthly means for a year and dividing by 12. The annual range is obtained as the difference between the highest and lowest monthly mean temperatures.
The Controls of Temperature • Latitude • Land and water distribution • Ocean currents • Elevation
Average temperature in JanuaryImportant: Adjusted for sea level!
Tale of three cities Fig. 3.14, p. 77
Stations at the same latitude and with the same average temp. • Even with the same average temperature, the range can differ considerably • Why might these be so different?
__________________ ________________ • Which curve is Juneau and which is Edmonton? • Why are they different?
Temperature terms • (Note: these are kind of confusing!) • “Average temperature”: the average of the high and low temperature for the day • “Normal temperature”: a 30-year average
Other ways to use temperature information • “Degree days” • When average temperature (average of high and low) is above 65 degrees F, people tend to use air conditioning • “Cooling degree days” • Each degree above 65 = one cooling degree day • When average temperature is below 65 degrees F, people tend to heat their homes/offices • “Heating degree days” • Each degree below 65 = one heating degree day
“Growing degree days” • When average temperature is above the base growing temperature for a crop
WEATHER EXTREMES ANDHUMAN DISCOMFORT • Body’s Perception: Sensible temperature • How we exchange heat energy with environment • Wind and cold • Body, like the planet, must also have a heat/energy balance if temperature is to be maintained. • Thin layer of warm molecules next to skin • Wind interferes with this, rapidly removes heat • Sensible temperature for cold weather: Wind Chill
Cold Hazards • Frostbite: Skin actually freezes and discolors • Cold, Damp Weather • A cold rainy day often feels colder than a “dry” one because water on exposed skin conducts heat away from the body better than air does • Hypothermia – body temp drops below normal • Most hypothermia occurs between freezing and 50° F, snow vs. rain, the wet really matters! • “Died of Exposure”
Dew Point (usually a better way to compare humidity) Fig. 3.20, p. 83
Heat index – factors in both temperature and humidity http://afs102.tamu.edu/?command=RTMC&screen=WxCenter