Download
1 / 18
180 likes | 267 Views
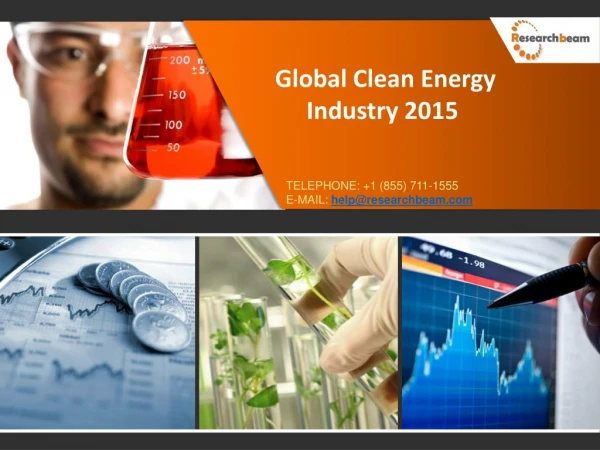
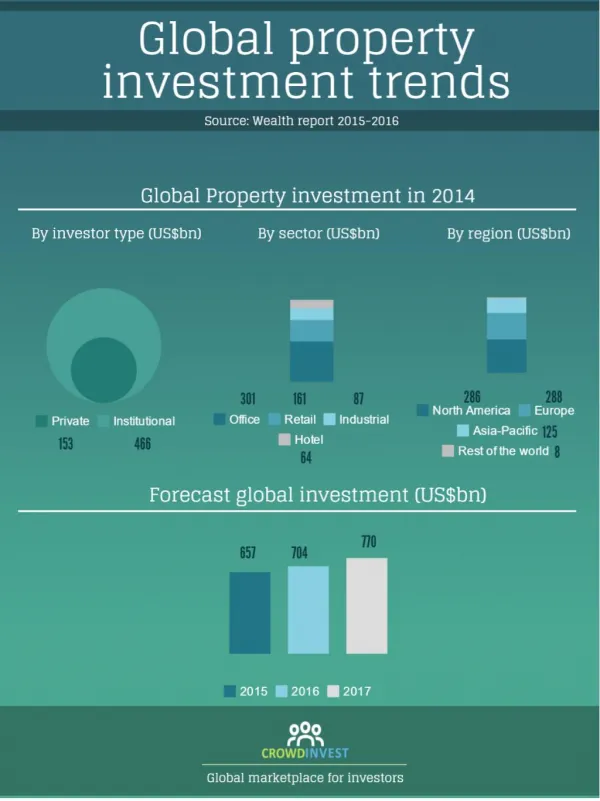
Global Trends in Clean Energy Investment TBLI. Michael Liebreich Chairman & CEO New Energy Finance. Yokohama, 28 th May 2009. Global new investment in clean energy, 2004 – 2008. 5% Growth. 59% Growth. $155bn. $148bn. 58% Growth. 68% Growth. $93bn. $60bn. $35bn. 2004. 2005.

E N D
Global Trends in Clean Energy InvestmentTBLI Michael Liebreich Chairman & CEO New Energy Finance Yokohama, 28th May 2009
Global new investment in clean energy, 2004 – 2008 5% Growth 59% Growth $155bn $148bn 58% Growth 68% Growth $93bn $60bn $35bn 2004 2005 2006 2007 2008 5xincrease from low level by around between 2004 and 2007 10%of global energy infrastructure spend But the top-line hides what is happening in the past few quarters Note: Adjusts for reinvested equity. Total value includes estimates for undisclosed deals. Source: New Energy Finance 1 [v9.02]
2009 2008 NEX S&P 500 NASDAQ AMEX Oil 500 Exposure to energy prices 450 Early stage 400 Capital Hungry 350 300 250 200 150 100 50 0 Jan-03 Jan-04 Jan-05 Jan-06 Jan-07 Jan-08 Jan-09 NEX Clean Energy Index: 2003 - 2007 Note: Values as of 13 May 2009; AMEX Oil, NASDAQ and S&P 500 rebased to 100 on 01 Jan 2003. Source: New Energy Finance, Bloomberg 2
Global third party new investment in clean energyQ1 2004 – Q1 2009($bn) 41.2 37.6 32.5 28.4 28.3 24.4 23.9 23.7 22.7 19.6 14.9 13.3 11.6 11.2 8.6 8.3 7.4 5.6 4.3 3.5 3.1 Q1 Q2 Q3 Q4 Q1 Q2 Q3 Q4 Q1 Q2 Q3 Q4 Q1 Q2 Q3 Q4 Q1 Q2 Q3 Q4 Q1 '04 '04 '04 '04 '05 '05 '05 '05 '06 '06 '06 '06 '07 '07 '07 '07 '08 '08 '08 '08 '09 Note: Includes 4 quarter running average. 3rd party investment only (i.e. does not include corporate and government R&D, or small residential scale projects). Does not adjusted for re-invested equity. Total values include estimates for undisclosed deals. Source: New Energy Finance [v9.04]
ASOC new investment in clean energyQ1 2004 – Q1 2009($bn) 7.2 6.7 6.9 6.4 6.0 5.6 4.5 4.1 3.8 3.8 2.8 2.3 1.8 1.8 1.2 1.0 1.0 1.0 1.1 0.8 0.5 Q1 Q2 Q3 Q4 Q1 Q2 Q3 Q4 Q1 Q2 Q3 Q4 Q1 Q2 Q3 Q4 Q1 Q2 Q3 Q4 Q1 '04 '04 '04 '04 '05 '05 '05 '05 '06 '06 '06 '06 '07 '07 '07 '07 '08 '08 '08 '08 '09 Note: Includes 4 quarter running average. Financial sector investment only (i.e. Corporate and government R&D, & small residential scale projects not included). Not adjusted for re-invested equity. Total values include estimates for undisclosed deals. Source: New Energy Finance [v9.04]
Attitude to the environment and economy – Old School It’s exciting when you have a real crisis on your hands, when you have spent half your political life dealing with humdrum issues like the environment… Margaret Thatcher, 1982 5
Attitude to the environment and economy – New School Finding the new driver of our economy is going to be critical. There is no better potential driver that pervades all aspects of our economy than a new energy economy… Barack Obama, 2008 6
Stimulus components targeted at clean energy By country By type Note: Estimates based on disclosed information, as of 18 May 2009. Percentages indicate percentage of total stimulus which is dedicated to clean energy. N/d indicates that the total stimulus sum was not disclosed. Source: New Energy Finance, government agencies [v9.02]
Merged/ Acquired 619 Reversion to local markets 344 Shift to short tenor lending +4% to +10% -20% to -30% -9% to -12% - 23% to - 40% -4% to -6% Increase in RE lending Net impact Wind: top project finance lenders, EU-27, 2007 & 2008(€m and %) Royal Bank of Scotland 1,977 European Investment Bank (EIB) 782 Nord LB 720 Grupo BBVA Nordic Investment Bank (NIB) 592 HSH Nordbank 579 BNP Paribas 461 Fortis Bank SA/NV 412 UniCredit 387 ING Bank 383 Banco Espirito Santo 356 Grupo Santander Banesto 307 Caja Madrid 307 Millennium BCP 305 Sabadell Bank Group 238 Credit Agricole SA 226 La Caixa de Barcelona (La Caixa) 224 Banque Federale des BP 216 Groupe Caisse d 216 ’Epargne Gruppo Banca Intesa 192 188 Commerzbank Group Note: Project finance lending converted to EUR at constant rate of 0.78968 EUR to USD Source: New Energy Finance 8 8 [v9.02]
Cost of Debt, Typical European Wind Farm Term Swap Credit Insurance Project Spread ECB Rate 6M Euribor 7% 6% 5% 4% 3% 2% 1% 0% Jan - 05 Jul - 05 Jan - 06 Jul - 06 Jan - 07 Jul - 07 Jan - 08 Jul - 08 Jan - 09 Notes: Data as of 27 May 2009; Term Swap: 8 year Euro swap rate. Source: New Energy Finance; Bloomberg 9
Weighted average silicon price for contracts before and after 30 September 2008, 2008-2015: $/kg 198 135 145 100 88 107 94 75 72 83 67 58 70 67 60 55 2008 2009 2010 2011 2012 2013 2014 2015 Prices in contracts as at end of Q4 2008 Prices in contracts as at end of Q3 2008 • Contract prices have dropped since Q4 2008 • High-priced silicon contracts have been renegotiated or cancelled • Latest silicon spot price is $60-90/kg and Chinese silicon price is on the low end. Note: This is based on the results published in Issue III of New Energy Finance Silicon Forward Price Index. “As at end of Q4 2008” refers to contracts as they stood before 31 December 2008, some of which have since been renegotiated. ‘As at end of Q3 2008’ refers to contracts as they stood before 30 September 2008, some of which have since been renegotiated. Source: New Energy Finance Silicon Price Survey, Issue III
$/W 6 Experience Curve for retail prices 5 Historical retail price data - Solarbuzz 4 44% Overshoot - retail 3 Sustained high - profit growth 2 Soft landing - retail Chinese factory - gate 1 prices 0 Dec - 02 Apr - 04 Sep - 05 Jan - 07 Jun - 08 Oct - 09 Feb - 11 The crystalline silicon module experience curve: $/W Note: Retail prices are paid by the consumer, factory-gate by distributor. Updated as of February 2009. Construction of experience curve based on Maycock data for factory-gate prices to 1975, parameters fitted to monthly retail price curve of Solarbuzz data from December 2002. Source: Solarbuzz, Maycock, SEC filings, New Energy Finance
Figure 1. Levelised cost of energy for solar technology, with California investor-owned utility weighted average market electricity prices Note: 8% return on capital, unlevered financing. 25-year project and contract life. Project-specific information attached in slides 3 and 4. Source: New Energy Finance, 2009 12
Biofuels: new build asset investment waves ($bn) Other Feedstocks 9.3 Sugarcane 8.2 6.0 3.3 3.1 3.0 2.5 1.0 0.8 0.7 0.4 2001 2002 2003 2004 2005 2006 2007 2008 Notes: Total values include estimates for undisclosed deals. Source: New Energy Finance 13 [v9.02]
Biofuels: Next-Gen VC/PE, Q4 2006 to Q3 2008(Investors and number of deals by country) Note: Disclosed deals only Source: New Energy Finance
Global Futures Emissions Scenarios and Investment Required CO2emissions from fuel combustion (Gtonnes per annum) 45 Base scenario with recession 2020 Peak Scenario 590 Base scenario without recession 2020 Peak Scenario 548 IEA Ref. Global Futures Base Scenario 40 502 461 35 373 408 IEA 550 ppm 348 264 30 269 214 IEA 450 ppm 155 148 25 93 59 2005 2006 2007 2008 2010 2015 2020 2025 2030 20 1990 2000 2010 2020 2030 Clean energy capital requirement per year: $bn Source: New Energy Finance Global Futures 2009, IMF’s World Economic Outlook (January 2009), IEA’s World Energy Outlook 2008. Notes: The data refers specifically to CO2 from fuel combustion and not greenhouse gases. 15 [v9.02]
Institutional investors’ clean energy investment intentions Based on106 Institutions with $1tr AUM Timber and forestry Venture Capital Agricultural commodities Expected allocation to clean energy investments by 2012 Expected change to clean energy allocations by 2012 More Less No change Projects 57% 41% More 75% Public Equity 54% 40% Carbon 50% 44% Unchanged 22% Private Equity 48% 48% 42% 55% Less 3% 36% 54% 32% 65% Source: New Energy Finance 16 [v9.01]
Briefing (newsletter) Industry Intelligence (data & news) Insight (research & analysis) Carbon price forecasting Carbon project analytics Consulting & advisory Executive workshops New Energy Finance Summit THANKS! Michael LiebreichChairman and CEO +44 20 7092 8803 www.newenergyfinance.com www.newcarbonfinance.com michael.liebreich@newenergyfinance.com Renewable Energy, BiofuelsCarbon Markets Energy Efficiency & Technology Carbon Capture & Sequestration Nuclear, Water