Download
1 / 107
1.08k likes | 1.09k Views
Spatial, Temporal, and Interpretive Limits of Functional MRI. Peter A. Bandettini, Ph.D Unit on Functional Imaging Methods & 3T Neuroimaging Core Facility Laboratory of Brain and Cognition National Institute of Mental Health. time. Anatomic. Functional. Echo-Planar Imaging.

E N D
Spatial, Temporal, and Interpretive Limits of Functional MRI Peter A. Bandettini, Ph.D Unit on Functional Imaging Methods & 3T Neuroimaging Core Facility Laboratory of Brain and Cognition National Institute of Mental Health
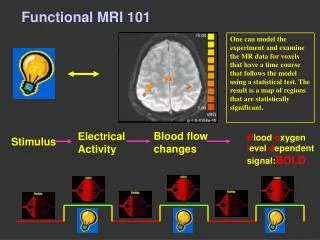
time Anatomic Functional
Single Shot Imaging T2* decay EPI Readout Window ≈ 20 to 40 ms
1991-1992 1992-1999
Imaging System Components Magnet RF Receiver Viewing Console X Y Z RF Transmitter Scan Controller Gradient Power Systems
2 G/cm, 350 T/m/s 4 G/cm, 150 T/m/s 10 G/cm, 1000 T/m/s
The use of fMRI to Investigate Brain Function Where? When? How much? --- How to get the brain to do what we want it to do in the context of an fMRI experiment?
A Primary Challenge: ...to make progressively more precise inferences using fMRI without making too many assumptions about non-neuronal physiologic factors.
Contrast in FMRI Hemodynamic Specificity • The Hemodynamic Transfer Function Location, Latency, Magnitude • Best Results So Far Temporal Resolution, Spatial Resolution • Neuronal Activation Input Strategies Block Design Phase and Frequency Encoding Orthogonal Designs Parametric Designs Event-Related Designs Free Behavior Designs
Contrast in FMRI Hemodynamic Specificity • The Hemodynamic Transfer Function Location, Latency, Magnitude • Best Results So Far Temporal Resolution, Spatial Resolution • Neuronal Activation Input Strategies Block Design Phase and Frequency Encoding Orthogonal Designs Parametric Designs Event-Related Designs Free Behavior Designs
Contrast in Functional MRI • Blood Volume • Contrast agent injection and time series collection of T2* or T2 - weighted images • BOLD • Time series collection of T2* or T2 - weighted images • Perfusion • T1 weighting • Arterial spin labeling • CMRO2 • BOLD and Perfusion w/ Normalization to Global Perfusion Change
Faster Slower
BOLD Contrast in the Detection of Neuronal Activity Cerebral Tissue Activation Local Vasodilation Oxygen Delivery Exceeds Metabolic Need Increase in Cerebral Blood Flow and Volume Increase in Capillary and Venous Blood Oxygenation Deoxy-hemoglobin: paramagnetic Oxy-hemoglobin: diamagnetic Decrease in Deoxy-hemoglobin Decrease in susceptibility-related intravoxel dephasing Increase in T2 and T2* Local Signal Increase in T2 and T2* - weighted sequences
The BOLD Signal Blood Oxygenation Level Dependent (BOLD) signal changes task task
Creating a Functional Image ON ON ON ON ON X Signal Time Course Reference Function =
Cross Correlation Image Cross Correlation Image Anatomical Image
Perfusion / Flow Imaging EPISTAR FAIR . . . - - - - Perfusion Time Series . . .
TI (ms) 200 400 600 800 1000 1200 FAIR EPISTAR
Comparison with Positron Emission Tomography PET: H215O MRI: ASL
Perfusion Rest Activation BOLD
Anatomy BOLD Perfusion
Hemdodynamic Stress Calibration 5% CO2 12% O2
20 3 15 2 10 BOLD (% increase) CBF (% increase) 5 1 0 0 -5 -10 0 200 400 600 800 1000 1200 1400 0 200 400 600 800 1000 1200 1400 Time (seconds) Time (seconds) hypercapnia visual stimulation Hoge, et al. CMRO2-related BOLD signal deficit: CBF BOLD Simultaneous Perfusion and BOLD imaging during graded visual activation and hypercapnia N=12
4 +10 +20 -10 0 25 3 20 15 CMRO2 (% increase) BOLD (% increase) 2 10 5 1 0 0 10 20 30 40 50 Perfusion (% increase) 0 0 10 20 30 40 50 Perfusion (% increase) Hoge, et al. CBF-CMRO2 coupling Characterizing Activation-induced CMRO2 changes using calibration with hypercapnia
Hoge, et al. Computed CMRO2 changes 40 30 20 10 0 % % -10 -20 -30 -40 Subject 2 Subject 1
Hemodynamic Specificity Arterial inflow (BOLD TR < 500 ms) Venous inflow (Perf. No VN)
Temporal vs. Spatial SNR- 3T 26ms 49ms 26ms 49ms SPIRAL 27ms 50ms 27ms 50ms EPI
0.25 Hz Breathing at 3T 3ms Image 26ms Respiration map Power Spectra 49ms 0 0.25 0.5 Hz
0.68 Hz Cardiac rate at 3T 3ms Image 26ms Power Spectra Cardiac map 49ms 0 0.68 (aliased) 0.5 Hz
1000 800 600 400 200 0 200 400 600 800 1000 Temporal S/N vs. Image S/N PHANTOMS SUBJECTS 1400 1200 1000 800 600 400 200 Temporal S/N Temporal S/N 0 200 400 600 800 1000 1200 1400 Image S/N Image S/N N. Petridou
CC Histogram Continuously Growing Activation Area Inflection Point Ziad Saad, et al
Contrast in FMRI Hemodynamic Specificity • The Hemodynamic Transfer Function Location, Latency, Magnitude, Linearity • Best Results So Far Temporal Resolution, Spatial Resolution • Neuronal Activation Input Strategies Block Design Phase and Frequency Encoding Orthogonal Designs Parametric Designs Event-Related Designs Free Behavior Designs
Hemodynamic Transfer Function Neuronal Measured Activation fMRI Signal Hemodynamics Physiolologic Factors
2 1000 msec 1.5 100 msec 34 msec 1 0.5 0 -0.5 -1 15 20 25 30 35 Time (sec)
+ 2 sec Latency - 2 sec Magnitude
Observed Responses measured ideal (linear) visual stimulation 250 ms 500 ms 1000 ms 2000 ms motor task 500 ms 1000 ms 2000 ms 4000 ms
20 s 2000 ms 1000 ms 500 ms 250 ms 0 10 20 30 40 0 10 20 30 40 BOLD response is nonlinear Observed response Linear response Short duration stimuli produce larger responses than expected
8 f (SD) 6 4 2 0 10 20 30 40 0 1 2 3 4 5 0 10 20 30 40 Stimulus Duration -2 8 f (SD) 6 60 4 40 2 20 0 1 2 3 4 5 0 2 0 2 4 6 8 Stimulus Duration -2 nonlinearity Results – visual task
Results – visual task Nonlinearity Magnitude Latency
8 f (SD) 6 4 2 60 0 10 20 30 40 0 10 20 30 40 40 0 1 2 3 4 5 Stimulus Duration 20 0 2 0 2 4 6 8 nonlinearity Results – motor task 8 f (SD) 6 4 2 0 1 2 3 4 5 Stimulus Duration
Results – motor task Nonlinearity Magnitude Latency