Download
1 / 15
150 likes | 297 Views
Raven’s Rock and the Tanawha Trail. Sarah Dochow Andrew May Callie Safley. Purpose. Estimate Value Determine Demand for the Environmental Resources Investigate Factors Permit Ranger Presence Maintenance . Theory. Demand Curve

E N D
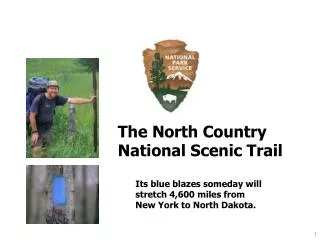
Raven’s Rock and the Tanawha Trail Sarah Dochow Andrew May Callie Safley
Purpose • Estimate Value • Determine Demand for the Environmental Resources • Investigate Factors • Permit • Ranger Presence • Maintenance
Theory • Demand Curve • Created by putting trips on the horizontal axis and the travel cost on the vertical axis • Consumer surplus • Region below the demand curve and above the average price level
Theory $ ΔCS CS TRIPS
Method • Random Interviews • At or near Tanawha Trail and Raven’s Rock • Hypothetical questions used to establish shifts in the demand curve • Demand curve • Derived from interview responses • Confirmed confidentiality • Made results available if requested
Data • Sample size = 38 people • Average Number of Trips to Tanawha Trail • 3.13 ± 0.67 • Average Number of Trips to Raven’s Rock • 1.907 ± 0.464
Data (cont.) • Average Willingness to Pay for hiking permit • $7.59 • SD = $10.81 • Average Travel Cost (.36*roundtrip distance) • $79.08 • SD = $113.76
Data (cont.) • 63% were male participants • Average Education level was 3.5 years of college • Average age was 34 • 74% were willing to pay for a permit
Statistical Results • We took the natural log of RP-trips and add one to get the values for the horizontal axis: ln(trips+1) • We had travel cost on the vertical axis calculated by: (.36*roundtrip distance) • We had three possible demand shifters but only one was statistically significant at the 92% level: (1-pvalue)= (1-.08)=.92
Consumer Surplus • Consumer Surplus • Semi-log: –x/b; where x = Number of Trips, b = travel cost coefficient • b = -.0015 • Number of trips to Ravens Rock: x = 1.908; CS = 1.908/.0015 = $1272 • Number of trips to Ravens Rock with the quality improvement: Δx = 1.36; ΔCS = 1.36/.0015 = $908
Aggregate CS • Individual ΔCS = $908 • Population of 5 counties = 903,568 • We assume that 5% are hikers (Outdoor Recreation Participation Study) • Aggregate ΔCS = 41,021,987.2
Analysis • Major Factor • People are more concerned with trail maintenance than costs • Bias • People live in these locations due to the fact that they enjoy activities, like hiking • Improvement for further Research • Larger sample size • More diversity among survey participants