Download
1 / 45
450 likes | 672 Views
ESC 305.01 GLOBAL CLIMATE CHANGE. Chapter 3. The Greenhouse Effect Part-2. Greenhouse Gases. Historically, greenhouse gas concentrations in the Earth´s atmosphere have undergone natural changes over time and those changes have been closely followed by changes in climate.

E N D
ESC 305.01 GLOBAL CLIMATE CHANGE Chapter 3. The Greenhouse EffectPart-2
Greenhouse Gases • Historically, greenhouse gas concentrations in the Earth´s atmosphere have undergone natural changes over time and those changes have been closely followed by changes in climate. • Warmer periods were associated with higher atmospheric greenhouse gas concentrations and cooler periods with lower atmospheric greenhouse gas concentrations.
Greenhouse Gases • However, those changes were part of natural cycles and took place over periods of tens of thousands to million of years. • Recent human-induced changes in atmospheric chemistry have occurred over decades (Ramanathan, 1988). • Thus, climate change is attributed directly or indirectly to human activity that alters the composition of the global atmospherein addition to natural climate variability, observed over comparable time periods.
Greenhouse Gases • Human activities generate several different greenhouse gases that contribute to climate change. • From the previous section, we know that CO2 and H2O(vap) are greenhouse gases. We usually keep H2O(vap) apart, since human influence on the overall hydrological cycle is negligible.
Greenhouse Gases • Water vapor traps heat in the atmosphere and makes contribution to the greenhouse effect. • Its level is not influenced directly by human activities, however, since warmer air can hold more water vapor, an increase in the Earth´s temperature resulting from other greenhouse gases produces a positive feedback. • That means more warming means more water vapor in the atmosphere, which, in turn, contributes to more warming.
Greenhouse Gas Emissions-Turkey • Total GHG emissions increased from 187 Mt CO2 eq. in 1990 to 366,5 Mt CO2 eq. in 2008. • Share of GHG emissions by gas in 2008: • CO2 81.0 % • CH4 14.8 % • N20 3.2 % • F-gases 1.0 % • Total GHG emissions increased 96 % between 1990-2008.
Greenhouse Gas Emissions-Turkey • Total GHG emissions decreased 3.5 % between 2007-2008; from 380 to 366,5 Mt CO2 eq. • Assessment of long term GHG trend (1990-2008): - Emissions have almost doubled since 1990, in all sectors except agriculture, - The increase has been driven by economic and demographic development, which resulted both in increasing energy demand and production,
Greenhouse Gas Emissions-Turkey - Turkey has the highest annual population growth of all European countries (+1.7 % population growth rate in 2005), - Turkey has the lowest per capita GHG emissions in the region. • GHG per capita has increased from 3.4 (in 1990) to 5.2 t CO2 eg/capita (in 2008).
Greenhouse Gas Emissions-Turkey • Assessment of short term GHG trend (2007-2008): - After a long period of increasing emission trend since 2001, emissions decreased significantly in 2008 in all sectors, - Road transport emissions showed a marked decrease. Source: EEA Report No:7/2010 (European Environment Agency).
Greenhouse Gases-Carbon Dioxide • A natural component of the atmosphere & very reactive. • It can be reduced to organic carbon bimass via photosynthetic uptake in plants and via biological oxidation (respiration), converted back to gaseous CO2 and returned to the atmosphere. • Major natural sources to the atmosphere; • Animal respiration • Microbial breakdown of dead organic matter & soil C • Ocean to atmosphere exchange (flux)
Greenhouse Gases-Carbon Dioxide • Major sink for CO2; • Photosynthetic uptake by plants • Atmosphere to ocean flux • These natural cycles maintained the atmospheric CO2 concentration at about 280 ± 10 ppmv (parts per million by volume) for several thousands years prior to industrialization in the mid-nineteenth century. • During the past 150 years, and especially during the last lew decades, humans greatly increased the concentration of atmospheric CO2.
Greenhouse Gases-Carbon Dioxide • Huge reservoirs of C, stored for millions of years as fossilized organic C (coal, oil & gas) in the Earth’s crust, have been removed and burned for fuel. • When C fuels burn, they combine with atmospheric oxygen to produce CO2, which enters the atmosphere. • Globally, 80 % of human CO2 emissions come from transportation and industrial sources. • The remaining 20 % comes primarily from deforestation and biomass burning.
Greenhouse Gases-Carbon Dioxide • Carbonate minerals used in cement manufacturing also release CO2 to the atmosphere. • These sources together contribute 6.5 billions tons (or gigatons) of carbon (GtC) to the atmosphere each year. • The rate of addition to the atmosphere from these sources exceeds the rate of loss to major CO2 sinks by about 3.3 GtC per year. • Thus, the atmospheric CO2 concentration of CO2 continues to increase.
Anthropogenic atmospheric carbon dioxide, fossil fuel emissions, world gross domestic product (GDP), and world population for the past century. Carbon dioxide data from Antarctic ice cores (green points), Mauna Loa Observatory (red curve), and the global network (blue dots) (Source: NOAA-National Oceanic Atmospheric Administration)
Carbon Dioxide • By the end of the 20. century, the atmospheric CO2 concentration had risen to over 367 ppmv; 31 % above its preindustrial level. • CO2 concentration continues to increase exponentially at about 0.5 % per year and the present atmospheric CO2 concentration has not been exceeded during the past 420,000 or perhaps even 20 million years (Houghton et al., 2001). • Even if current CO2 emissions are reduced and maintained at or near 1994 rates, the atmospheric CO2 concentration will keep on increasing during this century.
Greenhouse Gases-Carbon Dioxide • Fossil fuels are non-renewable and their supply is finite. • However, current supplies are abundant, relatively inexpensive, and could last for another 40-200 years.
CO2 in the Oceans • The major long-term reservoir (sink) for CO2 is the deep ocean. • Atmospheric CO2 dissolves in seawater to form bicarbonate and hydrogen ions, thus acidifying (lowering the pH) sewater. • The natural pH of the oceans is 8.0-8.3. • The solubility of CO2 decreases with increasing temperature. • Therefore, as the ocean warms, its ability to absorb CO2 from the atmosphere will decrease.
Solubility Pump • Carbon dioxide is continually exchanged with the air above the ocean across the whole ocean surface, particularly as waves break. • An equilibrium is established between CO2 in the water and in the air above. • Le Chatelier’s principle regarding this exchange says that if the atmospheric concentration of CO2 changes by 10 %, the concentration in solution in the water changes by only 1%.
Solubility Pump • So, when atmospheric CO2 concentration increases, more CO2 can dissolve in oceans. • However, if this surface water (with more CO2 in it) stays at the surface and warms up as it moves around the globe, the CO2 will quickly escape back to the atmosphere. • If the surface waters sink to the deep ocean, then the carbon can be stored for more than 1000 years before the ocean circulation returns it to the surface. • This process whereby CO2 is gradually drawn from the atmosphere in the ocean’s lower layers is known as the Solubility Pump.
Biological Pump • As well as physical removal, carbon dioxide is also taken up by phytoplankton in photosynthesis and converted into plant material. • Land plants and marine phytoplankton take up about the same amounts of carbon dioxide as each other, but marine phytoplankton grow much much faster than land plants. • Most of the carbon dioxide taken up by phytoplankton is returned to the atmosphere when the phytoplankton die or are eaten, but some is lost to the deep sea sediments in sinking particles. The sinking of this plant material is known as the biological pump.
Feedback Processes • As carbon dioxide and methane are added to the atmosphere through human activities, physical and biochemical feedback processes influence the overall effect of their concentration increase in the atmosphere. • Positive feedback: Accelerates and aggrevates the process. • Negative feedback: Slows down and pacifies the process.
Examples of Positive Feedbacks • Respiration by microorganisms increase as temperature increases more and more CO2 input to the atmosphere. • Release of methane from wetlands and sediments. As temperature increases, more methane is released. More methane increase in temperature more methane, and so on. • Temperature increase increase in evaporation more H2O(vap) in the atmosphere temperature increase yet more increase in evaporation.
Example of Positive Feedback with Ice Albedo Effect • Temperature increase melting of ice in the Arctic and Antarctic circles reflection of Sun’s rays diminishes more of the Sun’s energy stays on the surface and is converted to heat more heat more melting of the ice.
Examples of Negative Feedbacks • CO2 fertilization more plants and phytoplanktons more CO2 uptake. • However, there is a limit to this feedback through dying of plants and phytoplankton due to growth beyond carrying capacity of ecosystems. • Temperature increase increase in evaporation more cloud formation cutting off the radiation from the sun.
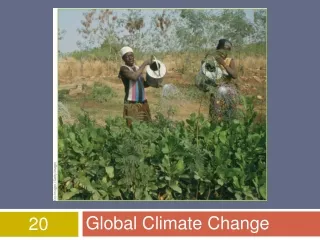
Methane • Methane (CH4) is produced by the microbial breakdown of organic matter in the absence of free oxygen (O2). • Methane (CH4) is emitted from a variety of both human-related (anthropogenic) and natural sources. • Natural sources include: • Wetland soils • Swamps • Some coastal sediments • Its atmospheric concentration has increased by 150 % since 1750 and is increasing rapidly by about 1.1 % per year. About half the current methane emissions are from human sources.
Methane • Human-related (anthropogenic) sources include: • Livestock production • Wetland rice cultivation • Solid waste landfills • Coal, oil & gas production • Global emission rates of methane appear to be variable and are difficult to quantify (Houghton et al., 2001).
Nitrous Oxide • N2O originates from; • Microbial breakdown of agricultural fertilizers, • Fossil-fuel combustion, • Biomass burning • Coal combustion is a major contributor of N2O to the atmosphere. • It has a long atmospheric lifetime (120-150 years). • Its atmospheric concentration has increased by 16 % since the industrialization era and continues to increase by about 0.25 % per year.
Chlorofluorocarbons (CFCs) &Hydrochlorofluorocarbons (HCFCs) • These are relatively inert class of manufactured industrial compounds containing carbon, chlorine and florine atoms. • They are used as; • Coolants in refrigerators and in air conditioners, • Foam insulation, • Aerosol sprays, • Industrial cleaning solvents. • These compounds escape to the atmosphere and they destroy the stratospheric ozone layer that shields the Earth from harmful UV radiation.
Chlorofluorocarbons (CFCs) &Hydrochlorofluorocarbons (HCFCs) • Montreal Protocol restricts their use. • Hydrofluorocarbons (HFCs), a CFC substitute, and related chemicals (Perfluorocarbon-PFC & Sulfur hexafluoride-SF6) also contribute the global warming.
Other GHGs • Carbon monoxide (CO) and nitrogen oxides (NOx) totally account for approximately 9 % of the total net warming. • Sources: • Fossil-fuel combustion • Biomass combustion
Warming Potentials • The postindustrial increases in GHG have resulted in an increase in global radiative forcing (warming) of 2.45 watts per square meter (W/m2). • This accounts only for 1 % of the net incoming solar radition, but it amounts to the energy content of about 1.8 billion tonnes of oil every minute (UNFCCC, 2002). • Each GHG contributes to this warming and each of GHG has different warming potentials. • The lifetime of the gas in the atmosphere also affects its resultant concentration and warming potential.