Download
1 / 13
130 likes | 295 Views
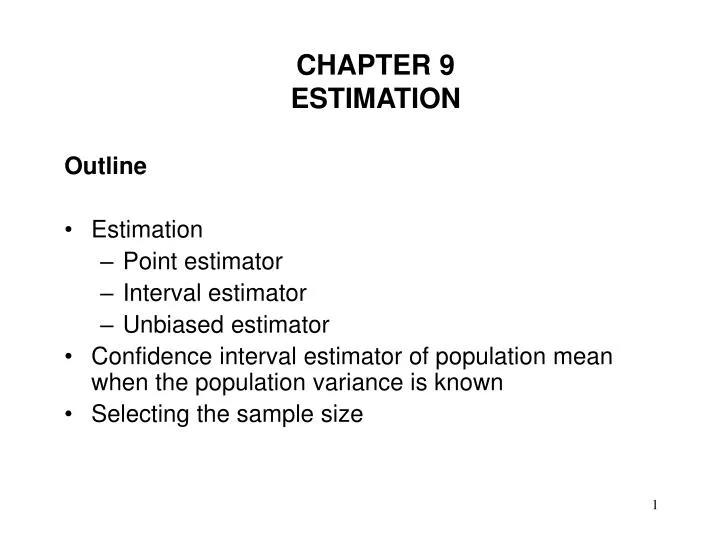
CHAPTER 9 ESTIMATION. Outline Estimation Point estimator Interval estimator Unbiased estimator Confidence interval estimator of population mean when the population variance is known Selecting the sample size. ESTIMATION.

E N D
CHAPTER 9ESTIMATION Outline • Estimation • Point estimator • Interval estimator • Unbiased estimator • Confidence interval estimator of population mean when the population variance is known • Selecting the sample size
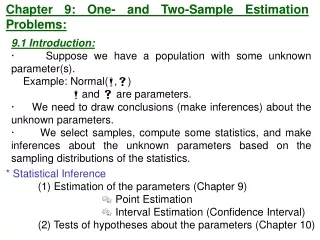
ESTIMATION • Point estimator: A point estimator draws inferences about a population by estimating the value of an unknown parameter using a single value or point. • Interval estimator: An interval estimator draws inferences about a population by estimating the value of an unknown parameter using an interval. • Example: A manager of a plant making cellular telephones wants to estimate the time to assemble the telephone. A sample of 30 assemblies show a mean time of 400 seconds. The sample mean time of 400 seconds may be considered a point estimate of the population mean. Chapter 9 will provide a method for estimating an interval.
ESTIMATION • Unbiased estimator: an unbiased estimator of a population parameter is an estimator whose expected value is equal to that parameter. • In Chapter 4, the sample variance is defined as follows: • The use of n-1 in the denominator is necessary to get an unbiased estimator of variance. The use of n in the denominator produces a smaller value of variance.
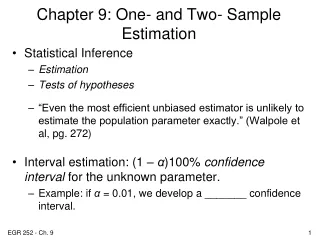
CONFIDENCE INTERVAL ESTIMATOR OF POPULATION MEAN WHEN THE POPULATION VARIANCE IS KNOWN • For some confidence level 1-, sample size n, sample mean, and the sample standard deviation, the confidence interval estimator of mean, is as follows: • Recall from Chapter 7 that is that value of z for which area on the right is /2 • Lower confidence limit (LCL) • Upper confidence limit (UCL)
CONFIDENCE INTERVAL ESTIMATOR OF POPULATION MEAN WHEN THE POPULATION VARIANCE IS KNOWN • Interpretation: • There is (1-) probability that the sample mean will be equal to a value such that the interval (LCL, UCL) will include the population mean • If the same procedure is used to obtain a confidence interval estimate of the population mean for a sufficiently large number of k times, the interval (LCL, UCL) is expected to include the population mean (1-)k times - See Table 9.2 on p. 310 for an example • Wrong interpretation: There is (1-) probability that the population mean lies between LCL and UCL. Population mean is fixed, not uncertain/probabilistic.
CONFIDENCE INTERVAL ESTIMATOR OF POPULATION MEAN WHEN THE POPULATION VARIANCE IS KNOWN • Interpretation of the 95% confidence interval: • There is 0.95 probability that the sample mean will be equal to a value such that the interval (LCL, UCL) will include the population mean • If the same procedure is used to obtain a confidence interval estimate of the population mean for a sufficiently large number of k times, the interval (LCL, UCL) is expected to include the population mean 0.95k times - See Table 9.2 on p. 310 for an example • Wrong interpretation: There is 0.95 probability that the population mean lies between LCL and UCL. Population mean is fixed, not uncertain/probabilistic.
CONFIDENCE INTERVAL Example 1 (Text 9.3): The following data represent a random sample of 10 observations from a normal population whose standard deviation is 2. Estimate the population mean with 90% confidence: 7,3,9,11,5,4,8,3,10,9
SELECTING SAMPLE SIZE • A narrow confidence interval is more desirable. • For a given a confidence level, a narrow confidence interval can be obtained by increasing the sample size. • Bound on error of estimation: If the confidence interval has the form of then, B is the bound on the error of estimation. • For a given confidence level (1-), bound on the error of estimation B and the population standard deviation the sample size necessary to estimate population mean, is An approximation for : = Range/4
SELECTING SAMPLE SIZE Example 2 (Text 9.11): Determine the sample size that is required to estimate a population mean to within 0.2% units with 90% confidence when the standard deviation is 1.0.
READING AND EXERCISES • Reading: pp. 303-322 • Exercises: 9.2, 9.4, 9.6, 9.12, 9.14