Download

1 / 38
380 likes | 490 Views
Subjective Well-Being is Not Unitary Ed Diener Daniel Kahneman Raksha Arora William Tov International Differences in Well-Being Princeton, 2008. SWB or WB Is Not one thing. Which are the happiest nations? Does money influence happiness?

E N D
Subjective Well-Being is Not Unitary Ed Diener Daniel Kahneman Raksha Arora William Tov International Differences in Well-Being Princeton, 2008
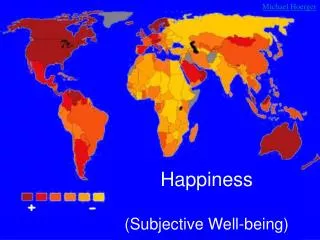
SWB or WBIs Not one thing • Which are the happiest nations? • Does money influence happiness? • What are the causes of happiness? Such questions assume there is one variable in “happiness”
BUT • Empirically – no • Diener, Lucas, etc. Life satisfaction, positive affect, etc. are separate • Conceptually • Kahnamen – judgment vs. momentary feelings are separate
Let’s take seriously the idea that “happiness” is more than one thing
We Propose a Dimension Global life judgments, reflective V • Life satisfaction • Reports of happiness V Momentary affect, feelings at the moment
Intercorrelation of Well-Being Measures Well-Being Life VariablesLadderSatisfactionHappiness Life Satisfaction .74 Happiness .62 .71 Affect Balance .53 .56 .71
Intercorrelation of Well-Being Measures Well-Being Life VariablesLadderSatisfactionHappiness Life Satisfaction .74 V Happiness .62 < .71 V V Affect Balance .53 < .56 < .71
Predicting Life Satisfaction Ladder Score Beta = .61 (p < .01) Affect Balance Beta = .28 (p < .01) • Predicting Happiness Ladder Score Beta = .23 (NS) Affect Balance Beta = .54 (p < .01)
Indicates the Ordering: Judgment-------------------------------------Feelings Ladder Life Satisfaction Happiness AffectBalance
Distributions Also Support a Distinction: Feelings versus Judgment different Cacioppo – “Positivity offset” Diener and Diener “Most people are happy” – but happy how?
Life Judgments Are Dramatically Less Positive than Affect • Biological? • Therefore more room to move?
Predictors Correlated with Four Measures of Well-Being Well-Being Income Per Choose How to Possession of CapitaSpend TimeConveniences Ladder Score .83 a .33 a .80 a Life Satisfaction .58 b .51 b .46 b Happiness .34 bc .54 b .16 bc Affect Balance .31 c .57 b .16 c
Judgment ------------------------------------- Feelings Ladder Life Satisfaction Happiness Affect Balance Income Psychological Conveniences Needs??? Prosperity e.g. Autonomy Positive
Easterlin Paradox:What About Changes in Income? Are changes in national income more associated with judgments than with feelings?
Two Waves of Data for Each SWB Variable Criterion – two surveys using same instrument more than five years apart Years Apart Ladder 36 Life Satisfaction 21 Happiness 20
Per Capita Income LadderLife Sat.Happiness Wave 1 PPP $ 8,148 $ 10,702 $ 11,187 Wave 2 PPP $ 19,938 $ 22,114 $ 20,332 Log10 Change .39 .33 .26
Well-Being LadderLife Sat.Happiness Wave 1 5.58 6.68 3.01 Wave 2 6.31 6.91 3.08 Difference: +.72 +.23 +.07 p < .01 .05 .10
Size of Mean Well-being Changes LadderLife Sat.Happiness Percentage of scale change 7 2 2 Between-nation .70 .23 .25 SD units
Correlations of Changes with Income Ladder r = .56, p < .05 Life satisfaction r = .33, p < .10 Happiness r = .24, NS
Change Regression Analyses: Over time predictions (Betas): Log income T1 SWBChange Ladder .85 .37 (p < .06) Life satisfaction .83 .26 (p < .01) Happiness .58 .22 (p < .10)
Box Score AnalysesAcross 3 SWB Measures: SWB Change Income ChangeDownUp Down 7 1 Up 25 65
Thus: • Asymmetry • When income down, SWB down 88 % • When income up, SWB up 72 %
Happiness Change GDP Up versus Down • Absolute change in Happiness • GDP up -- .16 scale score change • GDP down -- .37 scale score change p < .01
Conclusions • Types of SWB are not the same things • They can be ordered on the dimension from judgment to feelings • Judgments reflect income more • For the Ladder there appears to have been little scale recalibration • Feelings of SWB have changed less over time in response to income • Downward income change more powerful than upward income change
Easterlin’s Paradox? • Judgments more likely to change in response to changing income, although they do not invariably do so • Happiness is less related to income, and has been less responsive to income changes
Predictors Correlated with Four Measures of Well-Being Well-Being Income Per Choose How to Possession of Variables Capita Spend Time Conveniences • Affect Balance .31c .57a .16a • Ladder Score • Time 1 .82b • Time 2 .83d .33b .80c • Life Satisfaction • Time 1 .66a • Time 2 .58e .51a .46b • Happiness • Time 1 .35a • Time 2 .34ce .54a .16ab
Raw vs. Log Income • Ladder change and income change: • Log income r = .56, p < .05 • Raw income r = .16, NS Listwise N = 18
Income Up • Life Satisfaction down in 39 percent of nations when income rose • Happiness down 22 % when income up • Ladder down 22 % when income up