Download
1 / 16
160 likes | 321 Views
NOTES: Spectral Class (Color-Temperature Class) : Annie Jump Cannon (1912) classified dark lines for 200,000 stars! O B A F G K M <----------------- T BLUE RED Subclasses : Sun is a G2V star.

E N D
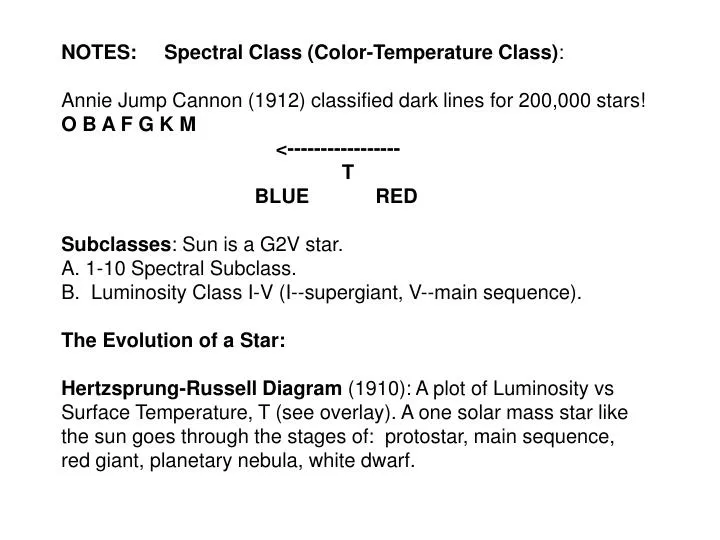
NOTES: Spectral Class (Color-Temperature Class): Annie Jump Cannon (1912) classified dark lines for 200,000 stars! O B A F G K M <----------------- T BLUE RED Subclasses: Sun is a G2V star. A. 1-10 Spectral Subclass. B. Luminosity Class I-V (I--supergiant, V--main sequence). The Evolution of a Star: Hertzsprung-Russell Diagram (1910): A plot of Luminosity vs Surface Temperature, T (see overlay). A one solar mass star like the sun goes through the stages of: protostar, main sequence, red giant, planetary nebula, white dwarf.
Spectral Class (Color-Temperature Class): Annie Jump Cannon (1912) classified dark lines for 200,000 stars! O B A F G K M Pnemonic: Oh Be A Fine Geek, Kiss Me
<------------------ T BLUE RED
Subclasses: Sun is a G2V star. A. 1-10 Spectral Subclass. B. Luminosity Class I-V (I--supergiant, V--main sequence).
Nearby stars can be plotted-- Luminosity vs Surface Temperature, T:
The more stars we plot, the more we see patterns. HR Diagram:
The majority of stars lie on the main sequence of the H-R Diagram where they burn Hydrogen in their cores.
Arthur Eddington’s great discovery! Mass determines stages of star life. Analogy: weigh the baby at birth, and know everything that will happen to the baby. He also proved stars bend light Like Einstein’s theory suggests.
Also he suggested that star pressure balances gravity. The outward pressure is created by heat and light.
The Hertzsprung-Russell, or H-R Diagram allows us to plot the stages of life of stars from their initial mass. Lifetime of a 1 solar mass star
Multiple Star Systems: More than half have companions. Most are: Binaries.
Optical double--a false binary --two stars not bound together, one at a greater distance. Albireo, an optical double. 10/25/03
Spectroscopic binary: We don't see separate stars, just separate spectra
Eclipsing binary--one star eclipses another. Two dips in the light curve.
Visual binary--actually seen as separate. Castor in Gemini: a visual binary