Download
1 / 42
450 likes | 554 Views
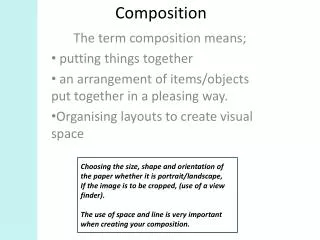
Map Composition . OR Making a Cool map. Steps to Creating a Map. Define the Purpose of the map Audience? Professionals? Lay public? How will map be used? Restate into a design problem Visualize the map Design solution - arrangement of map’s image elements to facilitate communication

E N D
Map Composition OR Making a Cool map
Steps to Creating a Map • Define the Purpose of the map • Audience? Professionals? Lay public? • How will map be used? • Restate into a design problem • Visualize the map • Design solution - arrangement of map’s image elements to facilitate communication • Sort of an outline • Graphic design esf Laboratory for Applied GIS
Map Elements used in design • Main map • Smaller scale inset maps showing location • Larger scale inset maps showing detail • Title of the map (usually prominent) • Subtitles • Legend (Only what is in the map!) • Scale (Only the Graphic scale. Xerox) • North Arrow (if not there up is assumed N) esf Laboratory for Applied GIS
Map Elements used in design • Graticule – a grid • Various text (notes, metadata, etc.) • Borders and neatlines • Symbols • Place names and labels • Photographs, Graphics • Mapped and unmapped areas (white space) esf Laboratory for Applied GIS
Important Scale note If nothing else these indicate …Accuracy! • Scale • A MUST! • Types • graphic -- the scalebar • verbal -- 1” = 1 mile (watch this one) • a ratio 1/24,000 (this one too) • Because of ubiquitous nature of Xerox machines the graphic scale is a must, the others are optional esf Laboratory for Applied GIS
Basic rules of Composition esf Laboratory for Applied GIS
Composition • How does the eye traverse the map • Balance of map – will it fall over? • Organization of map elements • Where is important stuff? • Division of space for interest • White space • Borders & neatlines • Text • Color esf Laboratory for Applied GIS
Movement of reader’s eye - upper left to lower right Field Focus esf Laboratory for Applied GIS
Visual center: 5% of total height aboveGeometric center -- Arrange content around this point Geometric center Composition: Planar Organization • Balance • visual impact of arrangement • is the map “heavy” at top, bottom, sides??? esf Laboratory for Applied GIS
Balance: Visual weight • Depends on location • obj weight increases with distance from center • obj at top are heavier than those at bottom • obj on right are heavier than those on left • Depends on size (Duh!) • Depends on color, interest, and isolation • Red>Blue, Bright>dark • complex > simple • isolated > groups • For Example … esf Laboratory for Applied GIS
A C B D E F esf Laboratory for Applied GIS
Which is better balanced? A B C D E F esf Laboratory for Applied GIS
Using Eye Movement Eye goes left to right Generally you want the reader to see the map BEFORE seeing the legend – can’t always do it esf Laboratory for Applied GIS
Unequal divisions of space more interesting than equal divisions esf Laboratory for Applied GIS
St. Louis too far from visual center, balance not bad, however • Hard to read name Better, but a heavy on right Balance with legend etc. esf Laboratory for Applied GIS
Location of St, Louis Legend -adf asdf adfafffdsf esf Laboratory for Applied GIS
Location of St, Louis Don’t really need since countries are labeled esf Laboratory for Applied GIS
Size / white space problems Is this a better balanced map? esf Laboratory for Applied GIS
Location of St, Louis Location of St, Louis Legend -adf asdf adfafffdsf Legend -adf asdf adfafffdsf Borders or Not • A dark fill works better than a light fill in establishing a border esf Laboratory for Applied GIS
TEXT esf Laboratory for Applied GIS
Text • No more than two fonts • Serif text, Sans Serif text • In each use the following to define hierarchy • Normal. italic, bold, spacing, color • UPPER and lower case • ALL UPPER CASE IS HARD TO READ • No fancy fonts • Big print for important stuff • Little print for not so important stuff esf Laboratory for Applied GIS
Using Color • Color is complex and tricky • There are definite color preferences • There are definite color combination preferences • There are standard color codes (like for planning) • The map should NOT be garish! esf Laboratory for Applied GIS
Color-Price • Earth tones (Brown, green, blue) • Better than strident colors (red, hot pink, purple) used only for small areas and for contrast or emphasis • Pastels for larger areas, dark for highlights (focus attention) esf Laboratory for Applied GIS
More Color • Blues and greens calming • Natural uses for water and vegetation • Reds and Oranges indicate danger • Avoid crosshatch fills – tiring • See pages 75-75 for more info esf Laboratory for Applied GIS
So • Creating maps is a creating a document for a specific purpose -- to communicate something to the reader • It is an iterative process • There are some basic rules or guides that can be used – described above an in the on-line course module. esf Laboratory for Applied GIS
Summary of Guidelines • Map layout – where are the pieces going to go – major pieces – visual center – eye path – uneven juxtaposition of parts • The map area and what’s in it • Legend placement (usually to right of map) • Scale bar, North Arrow • Balance • White space • Map Title – Large – may not be needed esf Laboratory for Applied GIS
Summary of Guidelines • Credits (Metadata) usually present • Borders and neatlines. • Border around ALL map pieces or solid fill • Neatlines (or fill) around (in) various pieces • Color – tricky – but not garish! esf Laboratory for Applied GIS
State & Cnty Highways Hydrology Lewis County Hydrology By Eustis B. Nifkin , Inc. Syracuse NY 10/10/05 esf Laboratory for Applied GIS
State & Cnty Highways Hydrology Lewis County Hydrology This map illustrates the a;dj;fa a;dljf a;dlfj aljdf a;sdf asdjf a;sdufdafdsf paseuef a;df;a ap[ef a;sduf asdfo aosdf [asdfi asdoif a[dsf [asdifdfi asdifd asdf By Eustis B. Nifkin , Inc. Syracuse NY 10/10/05 esf Laboratory for Applied GIS
Things I discovered • The next maps you see took several hours for the basic map • A really good map takes time • Turning on labels is ok but you have no control (or limited control) • Convert to annotation allows individual manipulation of the labels esf Laboratory for Applied GIS
The basic map as it appears in map view • Questions • Legend • Title • N arrow • Scale bar • Metadata • Neatlines • Lewis is a bad shape because of upper left esf Laboratory for Applied GIS
Making a map • The basic map w/ title and N arrow • Where’s the edge? • It was saved with a Transparent fill. • No border to hold the composition together! esf Laboratory for Applied GIS
Making a map Where did thatcome from? Text and scale always stuck in middle of map • The basic map w/ title and N arrow • Where’s the edge? • It was saved as Transparent • But the faint border keeps it all together. esf Laboratory for Applied GIS
Making a map • Added more stuff but background is still transparent • Balance does not look too bad esf Laboratory for Applied GIS
Making a map • Oops! • Put in a border around map • It came up with a fill color of yellow • Click on it and select properties to fix • And where did the second scale come from? esf Laboratory for Applied GIS
Making a map • Ah! • Better • But kind of garish • But • Balance good • White space OK • Legend? esf Laboratory for Applied GIS
Making a map • Aaah • Better • Still don’t like the hole where the N arrow is • Could put a legend there but this map does not need a legend esf Laboratory for Applied GIS
Making a map • Here is another approach • Landscape • Harder to do because map has to be smaller • So • Added more text • Added a highway legend after classifying the highways • Ech esf Laboratory for Applied GIS
Hummmm esf Laboratory for Applied GIS
Booby Trap • When you make scale bar it is grayed out? • Why? • You didn’t set map and distance units • If there are no map units then ArcGIS has no idea what they are ---probablyno metadata • If map units are m and you don’t want scale bar in meters then you have to set the distance units • Where? esf Laboratory for Applied GIS