Download
1 / 19
190 likes | 284 Views
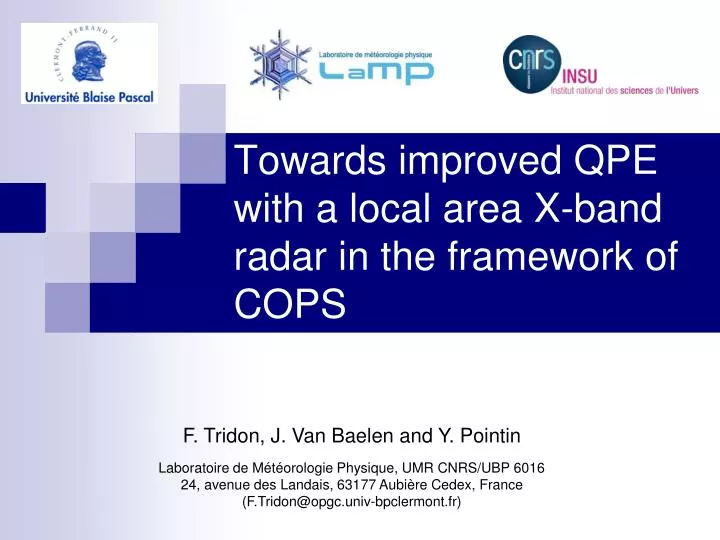
Towards improved QPE with a local area X-band radar in the framework of COPS. F. Tridon, J. Van Baelen and Y. Pointin Laboratoire de Météorologie Physique, UMR CNRS/UBP 6016 24, avenue des Landais, 63177 Aubière Cedex, France (F.Tridon@opgc.univ-bpclermont.fr). Introduction (1).

E N D
Towards improved QPE with a local area X-band radar in the framework of COPS F. Tridon, J. Van Baelen and Y. Pointin Laboratoire de Météorologie Physique, UMR CNRS/UBP 6016 24, avenue des Landais, 63177 Aubière Cedex, France (F.Tridon@opgc.univ-bpclermont.fr)
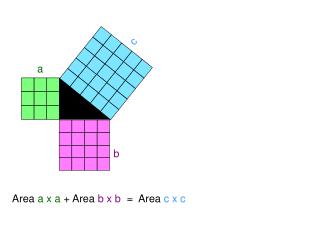
Introduction (1) • Radar technology: tool for quantitative rainfall measurements • Main parameters: • Reflectivity factor : Z (mm6.m-3) • Rainrate: R (mm.h-1) • Drop Size Distribution: DSD (l-1.mm-1) • Power law relationship: Z = aRb • Variability of DSD • Use of unique Z-R relationship for one precipitating event
Introduction (2) • Objective: Quantitative precipitation estimation on a small catchment basin with a simple scanning X-band radar • Use of a nearby vertically looking MicroRain Radar to: • study the properties of precipitation (DSD) with a high resolution • do a classification of different rain regimes within the same precipitating event • derive specific Z-R relationships for these regimes • Check the efficiency of these specific Z-R relationships against a single one
X-band radar (9.41GHz) • Elevation: 5° • High resolution: • Time: 30 s • Azimuth: 2° • Range: 60 m • Max range: 20 km
Micro Rain Radar (K-band, 24.1GHz) • Doppler spectra of 63 bins (0 to 12 m.s-1) over 32 range gates every 10 s • Relation between drop diameter and terminal fall velocity (Atlas et al. 1973): • Profile of DSD
Derivation of rain parameters: • Attenuation coefficient • Iterative attenuation correction • Reflectivity factor • Rain rate
June 15, 07 (IOP 3b) • Synoptic-scale through moving northeastwardly giving stratiform precipitation with weak showers over the COPS area
DSD temporal evolution • Grayscale: Number of raindrops in size interval • Bold solid line: Median-volume diameter • Thin solid lines: 10th and 90th percentiles of distribution of liquid rain water content over raindrop diameters • measure of the width of the raindrop size distribution
anomaly DSD temporal evolution • 1st period: small drops, narrow spectra, high variability • 2nd period: large drops, wide spectra, medium variability • 3rd period: low variability 1 2 3
Anomaly less visible near the ground • MRR measurement issue due to: • strong updraft • heavy attenuation • bad noise level estimation
Z-R relationships Global Specific 1 2 3
Corresponding rainfall Rainrate Cumulative rainfall
August 8-9, 07 (IOP 14b) • An intense large-scale precipitating system spread over the COPS area during all the night
DSD temporal evolution • 1st period: medium drops, medium variability • 2nd period: small drops, narrow spectra, low variability • 3rd period: small drops, narrow spectra, medium variability • 4th period: high variability 1 4 2 3
Z-R relationships Global Specific 1 4 2 3
Corresponding rainfall Rainrate Cumulative rainfall
Conclusions and perspectives High variability of rain even within a stratiform precipitation system Detection of temporally stable regimes of precipitation with significantly different Z-R relationships Derivation of the equivalent exponential or gamma distribution to explain the difference between the Z-R relationships Next step: apply these specific Z-R relationships on the X-band reflectivity
Conclusions and perspectives 3 2 1 1 3 4 2 Problem: How to detect these regimes with a single parameter X-band radar ? Periods of increasing, stagnating and decreasing intensity can be part of the same temporally stable regime of precipitation
Thanks for your attention Questions ?