Download
1 / 33
330 likes | 333 Views
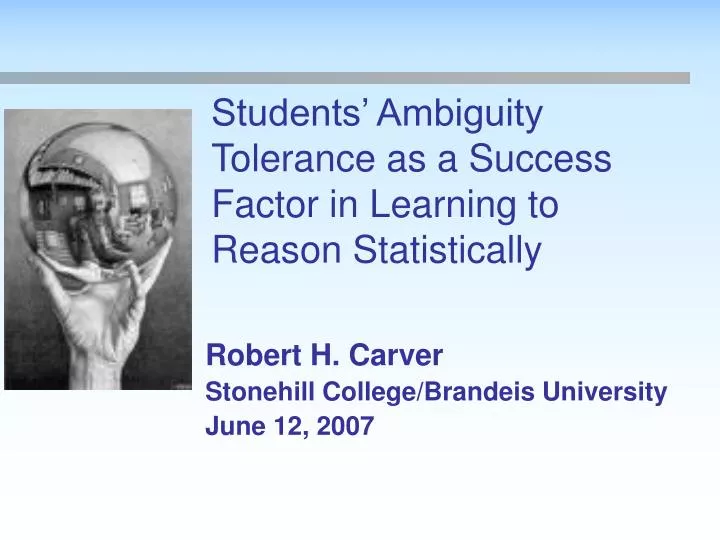
Students’ Ambiguity Tolerance as a Success Factor in Learning to Reason Statistically. Robert H. Carver Stonehill College/Brandeis University June 12, 2007. Quick Outline. Genesis of this Research Classroom experience Literature review JSM 2006 presentation Current project

E N D
Students’ Ambiguity Tolerance as a Success Factor in Learning to Reason Statistically Robert H. Carver Stonehill College/Brandeis University June 12, 2007
Quick Outline • Genesis of this Research • Classroom experience • Literature review • JSM 2006 presentation • Current project • Invitation to participate • Q&A
Genesis of the Research • Some observations from the classroom… • Learning statistics is difficult in many ways • Intro Stats can activate profound emotional responses • “but usually I like/I dislike math classes…” • Stat Ed literature • Focus on variation as a central theme • Studies on activities, techniques, topics • Relatively little work on variation among learners
Learners Vary! • Variation among learners • Prior coursework • Level of effort—motivation, capacity, etc. • Aptitude • Attitudinal orientation (Schau, et al.) • Myers-Briggs (BTI) • Other personality/emotional characteristics
Ambiguity Tolerance • Frenkel-Brunswik, Else (1948) • Ambiguity Tolerance Construct: • Some are stimulated by ambiguity, some are threatened • Personality trait vs. preferred process • Stable personality attribute vs. context-dependent • Relationship to rigidity, uncertainty tolerance, openness
The inner conflict Per Frenkel-Brunswick: Low ambiguity tolerance conflict & anxiety in ambiguous situations rigid adherence to preconceived ideas failure to process contrary evidence
Statistical Thinking • Statistical thinking requires simultaneous consideration of variation within one sample and among possible samples. • Statistical methods provide a means of making decisions in inherently ambiguous situations, relying on incomplete information. • Inference requires a leap of faith—a ready embrace of ambiguity
Contrast with ’Ambiguity’ in Decision Theory • Ambiguity as a property of the situation or state of knowledge • Ambiguity as property or proclivity of the thinker
Ambiguity Tolerance • Measurement Scales • Budner,1962 • Rydell; Rydell & Rosen 1966 • MacDonald, 1970 • Norton, 1975 • McLain, 1993
Questions • Do students with high AT have an advantage in learning to think statistically? • Do students with low AT tend to “shut down” when presented with instruction in inferential reasoning and techniques? OR • Do students with low AT welcome statistical thinking as a way to cope with ambiguity?
Methods Sample: • 85 undergraduates enrolled in 4 sections over 2 semesters • Differences among sections • Technology: Minitab vs. SAS • Normal, Learning Community, Honors • Informed consent • Credit & incentives • Course-embedded data collection
Methods Dependent variable: • Score on Comprehensive Assessment of Outcomes for a first course in Statistics (CAOS) post-test • Developed by Web ARTIST Project (U.Minnesota and Cal Poly) team • Pre- and Post-test • 40 items
Purpose of CAOS test The CAOS test was designed to provide an instrument that would assess students’ statistical reasoning after any first course in statistics. Rather than focus on computation and procedures, the CAOS test focuses on statistical literacy and conceptual understanding, with a focus on reasoning about variability. ARTIST project, University of Minnesota
CAOS post-test Illustrative question: Researchers surveyed 1,000 randomly selected adults in the US. A statistically significant, strong positive correlation was found between income level and the number of containers of recycling they typically collect in a week. Please select the best interpretation of this result.
CAOS post-test • We cannot conclude whether earning more money causes more recycling among US adults because this type of design does not allow us to infer causation. • This sample is too small to draw any conclusions about the relationship between income level and amount of recycling for adults in the US • This result indicates that earning more money influences people to recycle more than people who earn less money.
CAOS post-test • We cannot conclude whether earning more money causes more recycling among US adults because this type of design does not allow us to infer causation. • This sample is too small to draw any conclusions about the relationship between income level and amount of recycling for adults in the US • This result indicates that earning more money influences people to recycle more than people who earn less money.
CAOS post-test A study examined the length of a certain species of fish from one lake. The plan was to take a random sample of 100 fish and examine the results. Numerical summaries on lengths of the fish measured in this study are given.
CAOS post-test Improvement
Measuring AT Independent Measures & variables: • Abiguity Tolerance: • McLain’s 22 question instrument 7-point Likert Scales • Max score for extreme tolerance = 74 • Min score for extreme intolerance = - 58 • Reliability: Cronbach’s alpha = 0.897
Measuring AT Selected items: • I don’t tolerate ambiguous situations well. • I’m drawn to situations which can be interpreted in more than one way. • I enjoy tackling problems which are complex enough to be ambiguous. • I find it hard to make a choice when the outcome is uncertain.
Covariates Other explanatory factors and controls tested: • Score on CAOS Pre-test • Section controls • Cohort (55% 2006; 45% 2007) • Gender dummy (49% female; 51% male) • First-year student dummy (61% 1st year) • Math SAT • Prior Stat Education (37% had some) • Course cumulative average • Attendance
Findings: CAOS Pre-test A.T. did not have a significant main effect on Pre-test scores
Findings:CAOS Post-Test AT score has a significant (p < 0.10) effect on Post-Test reasoning score
Findings:CAOS Post-Test AT score has a significant (p < 0.05) effect on Post-Test reasoning score
Summary of Key Findings • AT non-significant in predicting pre-test scores • Suggests that the pre-test does not measure ambiguity tolerance • Significant findings re: prior coursework, academic preparation (though not much explanatory power), Math SAT
Summary of Key Findings • AT is significant in predicting Post-Test scores • Also significant • Pre-Test score • Prior statistics coursework (but negative) • First year dummy • Course results • Not significant • Gender, cohort, section, MathSAT
Discussion • Main Findings: • Ambiguity Tolerance may have a positive main effect • Low A.T. likely to be surmountable • Caveats: • CAOS scales measure several aspects of statistical thinking • Small sample • Substantial unexplained variance • Measurement issues: effort, engagement
Discussion • Implications: • An individual’s orientation toward ambiguity can affect his/her success with statistical reasoning. • Tolerance of ambiguity construct may provide a motivation for success • Course pedagogy may address A.T. directly • Note: Course averages not explained by AT
Discussion/Invitation • Research directions: • Can these results be replicated, especially in larger samples? • Would the results hold up with different measures of statistical reasoning? • Do other personality or personal style variables shape success in statistical reasoning? • How can we structure pedagogy to address personality variation among learners? • Does A.T. affect application of statistical reasoning in practice?
Q&A/ Discussion • Join me! • rcarver@stonehill.edu • rcarver@brandeis.edu • http://faculty.stonehill.edu/rcarver/