Download
1 / 20
200 likes | 217 Views
Reconstruction of Inundation and Greenhouse Gas Emissions from Siberian Wetlands over the Last 60 Years. T.J. Bohn 1 , R. Schroeder 2 , E. Podest 2 , N. Pinto 2 , K.C. McDonald 2 , C. Chiu 3 , L. C. Bowling 3 , and D.P. Lettenmaier 1

E N D
Reconstruction of Inundation and Greenhouse Gas Emissions from Siberian Wetlands over the Last 60 Years T.J. Bohn1, R. Schroeder2, E. Podest2, N. Pinto2, K.C. McDonald2, C. Chiu3, L. C. Bowling3, and D.P. Lettenmaier1 1Dept. of Civil and Environmental Engineering, University of Washington, Seattle, WA, USA 2JPL-NASA, Pasadena, CA, USA, 3Purdue University, West Lafayette, IN, USA American Geophysical Union Fall Meeting San Francisco, CA, 2010-Dec-16
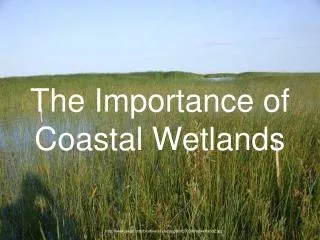
West Siberian Lowlands Importance of Lakes and Wetlands • Lakes: • Large CO2/CH4 source • CH4 estimates revising upwards due to ebullition • Wetlands: • Largest natural global source of CH4 • Large C sink • Northern Eurasia contains: • 30% of world’s wetlands (Gorham, 1991) • Large portion of world’s lakes Lehner and Doll, 2004 Lake/wetland carbon emissions are sensitive to climate High latitudes experiencing pronounced climate change
Lakes and Wetlands • Lake/wetland CH4/CO2 emissions depend on T, C, nutrients, oxidation state, etc • Wetland CH4/CO2 fluxes also depend on soil moisture CH4 Seasonally Inundated Soil (flooded) Permanent Lakes Unsaturated Soil Saturated Soil Water Table • Areal extent of wet zones can vary substantially in time • What role does temporal variation in area play in response of CH4/CO2 fluxes to possible end-of-century climate? • Can we improve model estimates by taking dynamic behavior into account? • Focus on CH4 for now…
Recent Progress • Emissions from unsaturated zone can be substantial (Bohn and Lettenmaier, 2010) • Common simplifications to wetland water table neglect unsaturated zone • Can result in biases of +/- 30% in end-of-century CH4 emissions • Here we consider a distributed water table
Monitoring the Sources • Water table measurements are localized and sparse • Extent of saturated/inundated wetlands can be monitored via satellite • Models can translate this into sub-surface soil moisture • Additional constraint on model soil moisture from streamflow observations • Simultaneous calibration using both satellite and streamflow observations
Modeling Framework • VIC hydrology model • Large, “flat” grid cells (e.g. 100x100 km) • On hourly time step, simulate: • Soil T profile • Water table depth ZWT • NPP • Soil Respiration • Other hydrologic variables… • Link to CH4 emissions model (Walter & Heimann 2000)
DEM (e.g. GTOPO30 or SRTM) Topographic Wetness Index к(x,y) Topographic Wetness Index CDF кmax кi кmin Water Table Depth Zwt(t,x,y) Soil Storage Capacity CDF(mm) = f(кi) Smax Cumulative Area Fraction 0 1 Saturated At Surface Water Table 0 Cumulative Area Fraction 0 1 Distributed Water Table Summarize for a Single 100 km Grid Cell 1 km Resolution VIC Spatial Avg Soil Moisture (t)
VIC Dynamic Lake/Wetland Model • Water & energy balance model • Includes mixing, ice cover • Dynamic area based on bathymetry • Can flood surrounding wetlands based on topography Special application: treat all lakes, ponds, and inundated wetland area as a single “lake” Bowling and Lettenmaier, 2010
Lake Bathymetry/Topography Lake size histograms from GLWD (Lehner and Doll, 2004) and LANDSAT Lake depths from literature Lake storage-area relationship LANDSAT courtesy of E. Podest and N. Pinto of NASA/JPL SRTM and ASTER DEMs for surrounding topography
Experiment • Select test basins in West Siberian Lowlands • Simultaneous calibration to both streamflow and inundated area • Streamflow gauge records from R-Arcticnet (UNH) • Inundated area derived from AMSR/QSCAT (NASA/JPL) • Hydrologic calibration parameters • Soil layer thickness • Infiltration distribution • Maximum baseflow rate • Effective lake outlet width • Parameters – CH4 • Calibrated against observations at Bakchar Bog (Friborg et al, 2003) • For lakes, use range of observed CH4 rates from literature: • 10-50 mg CH4/m2d (Repo et al, 2007) • 100-500 mg CH4/m2d (Walter Anthony et al, 2010) • Ultimate goal: estimate of responses of lakes and wetlands across West Siberia to end-of-century climate • For now: what are the sizes and seasonal behaviors of the various CH4 sources?
Close correspondence between: • wetness index distribution and • observed inundation of wetlands from satellite observations Study Domain: W. Siberia Wetness Index from SRTM and ASTER Ural Mtns WSL Peatland Map (Sheng et al., 2004) Ob’ R. Permafrost Syum Konda Dem’yanka Vasyugan Chaya
Comparison With Observed Discharge Monthly Avg Annual Flow Syum Modeled snowmelt pulse is narrower than observed Vasyugan Konda Interannual variability is good (where record is long enough) Dem’yanka
AMSR/QSCAT-Derived Inundation Annual Max – Min Fractional Inundation • Daily, for snow-free days • 2002-2009 • 25km resolution Courtesy R. Schroeder, NASA/JPL
Comparison With Observed Inundation Syum Seasonal inundation can more than double lake area Vasyugan Canonical lake area Konda Poor match because AMSR/QSCAT is lower than canonical lake area Dem’yanka Large saturated area
Monthly Averages - Syum Total Wetland = 18% Unsaturated wetland is the largest contributor to CH4 in summer because of its large area Lake + Inund + Saturated = 3.6% Lake + Inund = 1.3% Lake = 0.6% 1. Lake emits at same rate as saturated wetland 2. Lake emits at rate of 50 mg CH4/m2d 3. Lake emits at rate of 500 mg CH4/m2d CH4 (mg/m2mo) CH4 (mg/m2mo) CH4 (mg/m2mo) (=30 mg/m2d) (Fluxes per unit area of entire basin)
Annual Averages - Syum • If we assume high lake CH4 emission rates (100-500 mg/m2d) constant throughout year, lakes reach 9-32% of basin emissions • Otherwise, lake contribution small • Saturated wetland is largest component • Unsaturated wetland is second largest, due to its large area • This depends on wetland CH4 parameter set, and assumption that it applies everywhere in the wetland
Conclusions • Lakes have large per-area emissions but in many cases small total area • The saturated and unsaturated areas of the wetland are large contributors of CH4 as a result of their large extent • Total fluxes from these areas can be constrained to some extent via calibration vs. streamflow and satellite observed inundation • Further constraint with ground observations is needed
Future Work • Transfer calibration parameters to all of West Siberia • Estimate response of lake and wetland CH4 and CO2 emissions to possible future climates, over all of West Siberia • Role of dynamic inundation relative to T change? • Benefits of locally-calibrated vs global parameters • Estimate uncertainties • Where/when largest? • How to constrain?
Thank You This work was carried out at the University of Washington and the Jet Propulsion Laboratory under contract from the National Aeronautics and Space Administration. This work was funded by NASA ROSES grant NNX08AH97G.
Climate Factors Temperature (via metabolic rates) CO2 CH4 CO2 Relationships non-linear Water table depth not uniform across landscape - heterogeneous NPP Living Biomass Acrotelm Temperature (via evaporation) Aerobic Rh Water Table Precipitation Anaerobic Rh Catotelm Note: currently not considering export of DOC from soils