Download
1 / 35
350 likes | 353 Views
This report analyzes the demographic and socio-economic trends in Johnson County, Warrensburg. It explores key factors such as growth, economy, aging, immigration, and emerging characteristics. The report also includes information on demographics, socio-economic status, economic trends, and new forms of information. Data from various sources such as the Census Bureau and the U.S. Bureau of Labor Statistics are used to provide a comprehensive overview.

E N D
Demographic & Socio-Economic Trends in Johnson County Warrensburg August 21, 2007 Tracy Greever-Rice, Ph.D. Associate Director Office of Social & Economic Data Analysis University of Missouri--Columbia
Overview • Big Trends – growth, economy, aging, immigration • Emerging Characteristics in Johnson County • Demographics • Socio-economic Status • Economic Trends • New Forms of Information (ACS) • Discussion WWW.OSEDA.MISSOURI.EDU WWW.MCDC2.MISSOURI.EDU
Johnson County < 18 = 23.2 < 18 Minority = 13.1 < 18 LEP = 0.97
Missouri = 9.6% Johnson County 65+ = 10.2%
Johnson County 9.3% 11.2% 14.1% SOURCE: Census Bureau/NCHS. Projection algorithm, programming by OSEDA Chart Prepared by: University of Missouri Extension, Office of Social and Economic Data Analysis 24March2006
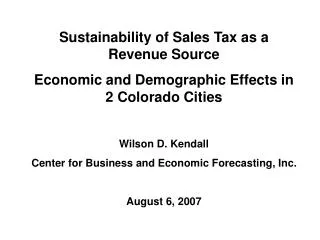
$35,000 $34,000 $33,000 $32,000 $31,000 $30,000 $29,000 2000 2001 2002 2003 2004 2005 Average Annual Wages: Missouri, 2000-2005 SOURCE: U.S. Bureau of Labor Statistics. SOURCE: U.S. Bureau of Labor Statistics.
SOURCE: U.S. Bureau of Labor Statistics. Source: US Bureau of Labor Statistics(BLS)
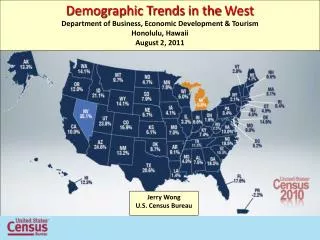
Economic Share Economic Share in Missouri by County St. Louis County (20.7%) and Jackson County (11.8%) together tally nearly one-third of the state’s economy. Source: MERIC
Overview • Big Trends – growth, economy, aging, immigration • Emerging Characteristics in Johnson County • Demographics • Socio-economic Status • Economic Trends • New Forms of Information (ACS) • Discussion WWW.OSEDA.MISSOURI.EDU WWW.MCDC2.MISSOURI.EDU