Download
1 / 98
980 likes | 990 Views
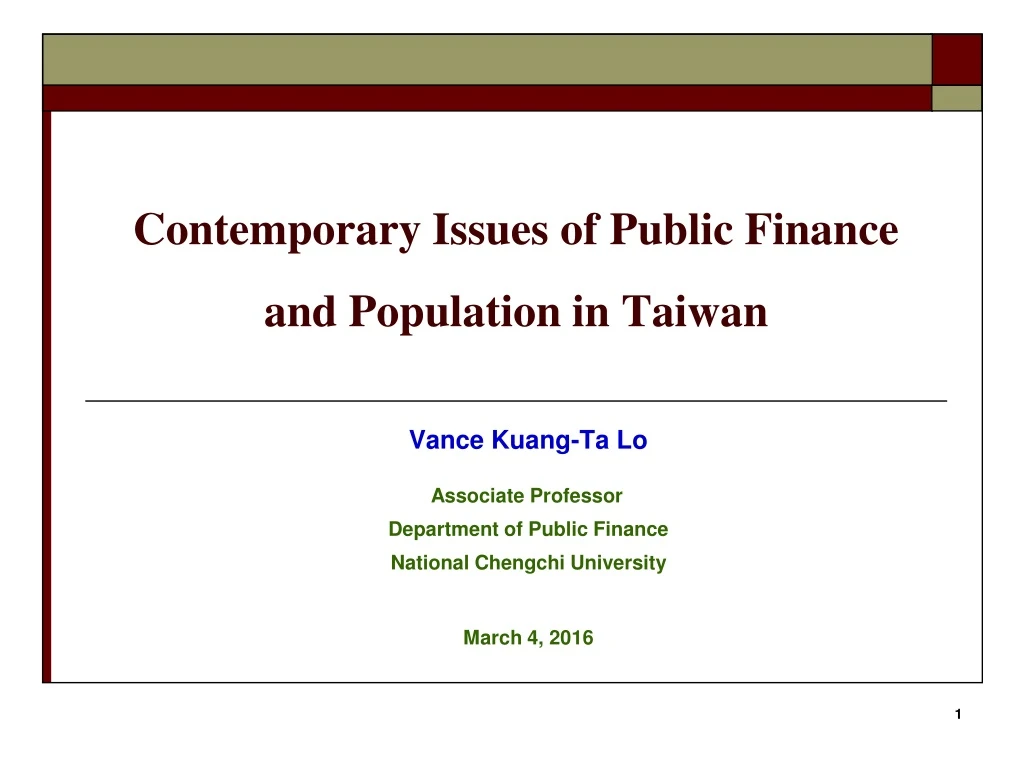
Contemporary Issues of Public Finance and Population in Taiwan. Vance Kuang-Ta Lo Associate Professor Department of Public Finance National Chengchi University March 4, 2016. Outlines. Part I:

E N D
Contemporary Issues of Public Finance and Population in Taiwan Vance Kuang-Ta Lo Associate Professor Department of Public Finance National Chengchi University March 4, 2016
Outlines • Part I: • Global Economic Situation and Outlook • Taiwan’s Current Economic Situation • Prospectsfor2016 • Taiwan’s Current Fiscal Challenges • Part II: • Demographic Pattern, Trend, and Projection • Problems and Challenges • Part III: • The Sound Finance Program • Tax Reform
Global Economic Situation and Outlook This part was prepared by the Department of Economic Development of the National Development Council (NDC). Quarterly updates can be found on the NDC’s website at http://www.ndc.gov.tw/encontent/m1.aspx?sNo=0001444.
Global Growth Faces Headwinds • Global economic growth disappoints and faces rising headwinds at the close of 2015 that may well persist into the next year. • Advanced Economies recovers at a modest pace. • The weakness in emerging markets, especially in Mainland China, drags down the global economy. WorldEconomicOutlookProjection Unit:% Note: The values in parentheses represent the previous forecast. ( OECD : Sep. 2015, EIU & GI : Nov. 2015 ) Source:1. OECD, Economic Outlook, Nov. 9, 2015 2. IHS Global Insight Inc., World Overview, Dec. 15, 2015 3. The Economist Intelligence Unit, Global Forecasting Service, Dec. 11, 2015
US Economic Fundamentals Remain Solid • US real GDP increased at an annual rate of 2.0% in the third quarter of 2015, mainly because private consumption was strong and fixed investment grew. • Since the unemployment rate was down and CPI had rebounded, the Federal Reserve raised interest rates on December 16, 2015. US unemployment rate (seasonally adjusted) US real GDP growth rate (SAAR) % % 6 4.6 4.3 3.9 4 2.1 2.0 2 0.6 Source:US Department of Labor, Dec. 4, 2015 US one-month percent change in CPI (seasonally adjusted) 0 -0.9 Q1 -2 Q2 Q3 Q4 Q1 Q2 Q3 2014 2015 Source:U.S. Department of Commerce, Dec. 22, 2015 Source:US Department of Labor, Dec. 15, 2015
Euro Zone Economic Growth Slows • Euro Zone real GDP growth rate slowed to 0.3% in the third quarter of 2015 (down from 0.4% in the second quarter), helped by a stronger performance by Spain (+0.8%). • The European Central Bank(ECB)will continue its quantitative easing through September 2016 and will delay interest-rate hikes until late 2017. EIU forecasts Euro Zone GDP growth at 1.5% in 2015, but risks are to the downside. Euro Zone economic growth by sector (% change) Source:IHS Global Insight Inc., World Overview, Dec. 2015 Source: Eurostat, Nov. 2015
Japan’s Economy Grow Slightly • The Japanese real GDP growth increased 0.3% in the third quarter (-0.1% in the second quarter), mainly because equipment investment grew significantly. • Growth will resume in late 2015, led by an upturn in consumer spending and continued growth in residential construction. • EIU forecasts that Japan will grow by 1.0% in 2015, increasing to 1.7% in 2016. Japaneseeconomic growth by sector (% change) Source:IHS Global Insight Inc., World Overview, Dec. 2015 Source: The Cabinet Office, Dec. 2015
Mainland China’s Economy Continues to Decelerate • Mainland China faces overcapacity and industrial structure adjustment to the economic "new normal”. Growth in industrial output, fixed investments, retail sales, and total value of imports and exports in the first to third quarter all slowed, this year's economic growth forecast is less than 7%, a record low since 1990. • The Service sector for the first 3 quarters grew by 8.4%, while its share of nominal GDP increased to 51.4%, the final consumption expenditure contribution rate is was 58.4%, showing consumption has gradually become the main driver of China's economic growth momentum. Growth rates of main economic indicators (% change) Source:National Bureau of Statistics of the People’s Republic of China Source:National Bureau of Statistics of the People’s Republic of China, Oct20,2015
Economic Growth Slowed Further • In Q3 2015, real GDP grew at a rate of -0.63%, lower than the 0.10% previously projected by the Directorate-General of Budget, Accounting and Statistics (DGBAS). Due to the sluggish demand in global consumer electronic products, and the crowding out effect from the expanded supply chain in Mainland China, Taiwan’s commodity exports decreased. • The seasonally adjusted annual rate (SAAR) was -1.20%. forecast Note: : DGBAS also revised the national accounts for 2013 and 2014Source: Directorate-General of Budget, Accounting and Statistics (DGBAS), Nov. 2015
Foreign Trade Momentum Curbed • Total exports contracted by 3.01% year-over-year in Q3 2015, lower than the -0.74% growth in Q2 2015, mainly due to the weak demand in global consumer electronic products, coupled with the crowding out effect from the expanded supply chain in Mainland China. • Imports fell by 2.24% from a year earlier, with the decrease in consumption and exports. forecast Source:DGBAS, Nov. 2015 12
Major Trade Partners • Exports for the first 11 months of 2015 to the ASEAN-6, China (including Hong Kong), Europe, and Japan declined by 14.3 %, 11.9%, 11.6% and 2.9% respectively compared with the same period last year. Changes in Two-Way Trade with Major Trading Partners (y/y%) *ASEAN 6 refers to Indonesia, Malaysia, the Philippines, Singapore, Thailand, and Vietnam Source:Ministry of Finance, Dec. 2015
Domestic Consumption Growth Slowed • Private consumption grew 0.5% from a year earlier in Q3 2015, lower than the 3.55% growth in Q2 2015, while the stock market’s trading value and tourists decreased. forecast Private Consumption Growth y/y, % 5 4 3 2 1 0 Source: DGBAS, Nov. 2015
Domestic Investment Up Slightly • Gross fixed capital formation was up by 3.1% year-over-year in Q3 2015, withprivate enterprise gross fixed capital formation increasing by 5.11%, higher than the -0.64% of Q2. A rise in semiconductor and train locomotive investment was partially offset by a decrease in construction engineering investment. forecast 30 Private fixedinvestment Public enterprisefixed investment Governmentfixed investment y/y,% 20 Gross fixed capital formation 10 0 -10 -20 -30 -40 Q1 Q2 Q3 Q4 Q1 Q2 Q3 Q4 Q1 Q2 Q3 Q4 2013 2014 2015 Total 5.30 1.76 0.93 Privateenterprises 7.09 3.17 2.02 Government -2.79 -7.36 -2.53 Publicenterprises 2.99 5.31 -6.06 Source: DGBAS, Nov. 2015
Employment Remains Steady • The unemployment rate stood at 3.91% in November 2015, up by 0.01 percentage points over the previous month. The seasonally adjusted unemployment rate increased by 0.05 percentage points to 3.84%. • The labor force participation rate increased by 0.01 percentage points over the previous month to 58.74%, up 0.08 percentage points compared with that of a year earlier. % % 6.0 5.5 5.0 4.5 59.0 58.74 58.5 58.0 57.5 57.0 56.5 56.0 3.91 4.0 Labor force participation rate (leftscale) 3.5 Unemployment rate (rightscale) 3.0 1 3 5 7 9 11 1 3 5 7 9 11 1 3 5 7 9 11 1 3 5 7 9 11 2012 2013 2014 2015 Source: DGBAS, Dec. 2015
Prices Stable • Taiwan’s CPI in November 2015 moved up 0.53% compared with the same month last year, mainly due to the 30.5% increase in the vegetables index. In addition, the lowering of gas and electricity prices led to a decline in prices of water, electricity, and gas of 13.65%. Core prices (excluding fruit, vegetable and energy prices) increased by 0.86%. • The WPI decreased by 7.75% year-over-year, due to the decline in indexes for petroleum and natural gas. y/y, % 4 0.53 0 -4 -7.75 CPI -8 WPI -12 1 3 5 7 9 11135791113579111357911 2012 2013 2014 2015 Source: DGBAS, Dec. 2015
Stock Index Continues to Fall • The average closing price of TAIEX was 8,502 in November 2015, down by 0.6% from the previous month, while it decreased by 5.7% compared with the same month the previous year. Stock Index Source:Taiwan Stock Exchange, Nov. 2015
Economy Gradually Improve in 2016 • According to DGBAS’s latest estimation in November, GDP growth rate in 2015 is forecast to be 1.06%, down 0.5 percentage points over August’s forecast, mainly due to weak domestic demand and a slump in exports. • The world economy is anticipated to perform better in 2016, which will sustain Taiwan's export growth. Moreover, domestic public spending will increase. Real GDP is forecast to grow by 2.32% in 2016. Economic Outlook Contributions to GDP growth rate (percentage points) GDP growth rate(%) GDP growth rate 6.00 6 3.92 3.80 4.00 4 2.20 2.06 2.32 1.06 2.00 2 0.00 0 -2.00 -2 Contributions of domestic demand 2011 2012 2013 Contributions of net foreign demand 2014 2015 f 2016 f -4.00 -4 year Source: DGBAS, Nov. 2015
Exports Fall in 2015 But Expected to Revive in 2016 • Taiwan's exports plummeted due to the sluggish demand in global consumer electronic products, the crowding out effects from the expanded supply chain in Mainland China, and the falling price of crude oil. Real goods and services exports are projected to grow by 0.15% in 2015. • With the gradual recovery of the global economy, real goods and services exports are projected to rise by 4.74% in 2016. The Growth Rate of Nominal Goods Exports The Growth Rate of Real Goods and Service Exports and Imports % (y/y) % 10 6.77 2015 growth rate: 8 5.33 Goods and services exports forecast -10.16% 5.91 5 6 4.74 0.10 3.50 5.65 0 4 4.25 0.86 3.4 2 -5 -4.19 0.41 -4.18 0 -10 0.15 2016 growth rate: -9.83 1.97% -12.23 -2 -13.87 Q3(p) -15 quarter -1.78 Goods and services imports 2013 2014 2015 f Q1(r) Q2(r) Q4(f) Q1(f) Q2(f) Q3(f) Q4(f) -4 year 2015 2016 2012 2016f Source: DGBAS, Nov. 2015
Private Consumption to Remain Stable • In the first half of 2015, consumer spending rose solidly because of increasing employment and rising wages, plus increasing numbers of people traveling abroad. However, in 2015 Q3, the weak economic data weighed on consumer confidence. In 2015 Q4, the government launched a consumption-boosting program that will stimulate domestic consumption. Overall, private consumption is projected to rise by 2.55% in 2015. • In 2016, private consumption is expected to increase only by 1.76%, owning to the end of the consumption-boosting program and the fallout from a disappointing economy in 2015. The Growth Rate of Private Consumption (y/y) 2015 growth rate: 2.55% % 2016 growth rate: 1.76% quarter Source: DGBAS, Nov. 2015
Domestic Investment to Grow Steadily • In the first half of 2015, private fixed investment showed only slight growth. In 2015 Q3, semiconductor manufacturers continued to invest in advanced technologies, and increased investment in public transportation will help boost private investment. However, tepid construction investment affected by the slowdown in the housing market will restrain private investment. Private fixed investment is projected to increase by 2.02% and 0.97% in 2015 and 2016, respectively. • Government fixed investment is expected to decrease by 2.53% in 2015, but to rise by 3.60% in 2016, mainly due to the government’s expansionary fiscal policy. The Growth Rate of Private Investment The Growth Rate of Fixed Investment (y/y) % 10.00 % 7.09 forecast 6 5 4 3 2 1 0 -1 5.31 Private sector 5.11 3.60 3.60 2.02 -0.35 2.99 3.17 0.00 -2.53 2.71 0.97 2.26 -7.42 -7.36 -2.79 1.33 0.73 0.66 -6.06 10.00 -10.95 Public enterprises Government -0.04 -0.64 Q1(r) Q2(r) Q3(p) Q4(f) Q1(f) Q2(f) Q3(f) Q4(f) quarter 20.00 year 2015 2016 2012 2013 2014 2015f 2016f Source: DGBAS, Nov. 2015
Forecasts for Taiwan’s Economy DGBAS = Directorate-General of Budget, Accounting and Statistics, ROC (Taiwan) ; CIER = Chung-Hua Institution for Economic Research, Taipei ; TRI = Taiwan Research Institute ; TIER = Taiwan Institute of Economic Research, Taipei ; Yuanta-Polaris = Yuanta-Polaris Research Institute ; IEAS = Institute of Economics, Academia Sinica ; ADB = Asian Development Bank ; EIU = Economist Intelligence Unit ; IMF = International Monetary Fund. [ ] indicates the value of previous forecasts
Remarks (1/2) • Due to continuing weak global demand, Taiwan’s exports have seen double-digit year-on-year contractions in value in most months of 2015. • However, domestic demand remains moderate to sustain an economic growth momentum. According to DGBAS’s latest estimation in November, Taiwan’s GDP growth is expected to decrease by 0.63% in 2015 Q3, but to rise by 0.49% in 2015 Q4. In 2015, real GDP is forecast to grow by 1.06%.
Remarks (2/2) • In 2016, Taiwan's GDP is projected to grow by 2.32% since the world economy is anticipated to perform better in the future. • Nevertheless, the Mainland China economy shows a downward pattern, and because emerging markets could face a liquidity crisis, it means caution is still needed in the near future.
Our Current Fiscal Situation • From 2008 to 2014, the annual expenditure is usually greater than the annual revenue, and the budget fiscal deficit of 2014 was US$ 7.1 billion. • If we take the repayment of debt into consideration, the total fiscal deficit is US$ 9.2 billion, which should be balanced mainly by the issuance of debt.
However, the outstanding debt in Taiwan has shown an upward trend. The ratio of outstanding debt to the average nominal GDP for the previous three fiscal years increased from 30.7% in 2008, 37.5% in 2013, and 38.1% in 2014, which is approaching to the legal debt ceiling of 40.6%. • Therefore, it is quite difficult to balance our fiscal deficit by the issuance of debt. If the government does not adopt any reform measure, we may face fiscal difficulty in few years.
Gradual Increase in Statutory Expenditure • The statutory expenditures have also shown an upward trend from 2008 to 2014. The overall figures also show that our expenditures are quite rigid and inflexible.
Increase in Expenditures due to Change in Major Policies • Moreover, the structure of the population is changing. For example, a low fertility and an aging population are having an impact on related policies. In addition, we are planning to implement the major policies of “12-Year National Fundamental Education” and “Long-Term Care” among others. And, thus, we expect that the related expenditures will be on the increase.
Revenue Structure and Tax Burden Ratio • As for our revenue structure, tax revenue composes the main part of the revenues. The ratio of tax revenue to total revenues was 70.4﹪in 2013. However, our tax burden ratio was only 12.6% in the same year. This means that there is still room for raising tax revenue. Revenue Structure Tax Burden Ratio
Remarks (1/5) We think there are three main challenges to Taiwan’s fiscal account, which lead to concern over continued fiscal deficits and rising government debt level. (1) Sub-trend GDP growth • With its high export dependency, Taiwan’s economic growth is negatively affected since the onset of the global credit crisis in 2008. • Weakened consumption demand in the developed markets have been negatively affecting Taiwan’s export sector and the overall economy.
Remarks (2/5) • The growth slowdown has impacted the fiscal accounts in two ways: • First, it has slowed the growth in fiscal revenue. Taiwan’s general government net revenue growth has slowed to 0.8% per year from 2008 to now, compared to 3.8% per year from 2004 to 2007. • Second, it has expedited the growth in fiscal expenditure. Because of the slowdown in growth, the government has to allocate more spending on infrastructure projects to boost the economy. As a result, net general government expenditure growth has accelerated to 3.5% per year between 2008 and now, up from 0.9% per year between 2004 and 2007.
Remarks (3/5) (2) Low tax burden • Taiwan’s tax revenue represented only about 12.2% of GDP in 2012, which is much lower than other countries.
Remarks (4/5) (3) An aging population • We think an aging population is the most serious challenge to Taiwan’s fiscal condition in the coming years. • According to the Council for Economic Planning and Development (CEPD), Taiwan’s population is expected to rapidly age starting from 2013 onwards. • The percentage of old-age population (defined as age 65 and above) is expected to rise from 11.5% of the total population in 2013 to 14.6% in 2018, and continue rising in subsequent years. • At the same time, the working-age population (defined as age 15 to 64), is expected to shrink from 74% of total population in 2013 to 72.7% in 2018. • The old-age dependency ratio is hence expected to drop from around 6.4 in 2013 to 4.9 in 2018, and continue deteriorating.
Remarks (5/5) • The aging of Taiwan’s population is structural, which makes it very difficult to alter by the government over the medium term. • This should have serious implications on the government’s tax revenue, and more importantly, on the government’s social security and pension-related spending. • In 2011, social security and pension expenditure represented 5.5% of GDP and 28.7% of the general government net expenditure. • The ratios are projected to rise further to over 7% of GDP and 33% of government expenditure in 2018 as the population ages, assuming no effective reform measures are introduced to avert the trend.
Contemporary Issues of Population in Taiwan (Special thanks to Prof. Jr-Tsung Huang for sharing this PPT)
The age composition of population has become a major issue in countries. • Based on the definition from World Health Organization (WHO), 7% : Aging 14%: Aged 20%: Super-Aged the percentage of elders over 65 years old >
Changes in people structure toward aging will affect the macroeconomic interior, especially the government fiscal, and might have economic loss from a declining working-age population. • Accordingtothe data, the total population in Taiwan was last recorded at 23,492,074 people in 2015 from 15,927,167 in 1974, changing 47.4% during the last 51 years.
Based on medium-variant projected population, the peak population of Taiwan will reach 23.5–23.6 million during 2019–2026, representing an increase of 100,000–230,000 over 2014. • By 2060, the population will have fallen to approximately 16.9–19.5 million, approximately 72%–83% of the population in 2014. • However, based on medium-variant projection, negative population growth will occur in 2019 at the earliest and in 2026 at the latest.
Figure 3 presents a time trend of general fertility rate (GFR, hereafter) and total fertility rate (TFR, hereafter) of Taiwan during 1981-2014. • TFR has been lower than replacementlevelof2.1 since 1985. • In 1985, the TFR was 1.88. It was even lower than 1 in 2010, only 0.895.
General fertility rate (GFR) • the number of births in a year divided by the number of women aged 15–44, times 1000. It focuses on the potential mothers only, and takes the age distribution into account. • Total fertility rate (TFR) • the total number of children a woman would bear during her lifetime if she were to experience the prevailing age-specific fertility rates of women. TFR equals the sum for all age groups of 5 times each ASFR rate. Age Specific Fertility Rate (ASFR) = (Number of births to women in age group i / Number of women in age group i) x 1000 LetB=Numberofbirth LetW15-44=Numberofwomenofreproductiveages Total Fertility Rate (TFR) = (The sum of the ASFRx The number of years in each age group) / 1000
Interestingly, the fluctuations of both fertility rates shown in Figures 3 follow Taiwanese people’s preference of some peculiarly Chinese characteristics. • For example, Dragon is most auspicious, but Tiger is most stigmatized. Snake is also less auspicious. • Therefore, every Taiwanese parent is hoping to have a Dragon baby, but not a Tiger baby.