Download
1 / 29
300 likes | 332 Views
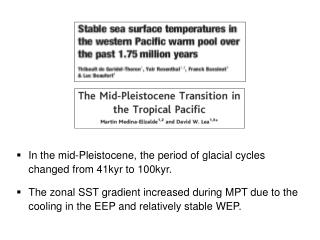
Characterizing and understanding the Quaternary Glacial/Interglacial cycles. Earth’s Climate and Environment: Past, Present, and Future GEOL 3100. Effects of the Ice Ages on air and ocean temperatures. What is the response time of the atmosphere to forcing?

E N D
Characterizing and understanding the Quaternary Glacial/Interglacial cycles Earth’s Climate and Environment: Past, Present, and Future GEOL 3100
Effects of the Ice Ages on air and ocean temperatures • What is the response time of the atmosphere to forcing? • What is the response time of the surface ocean to forcing? • What would provide good geologic records of atmospheric and surface ocean temperatures? • Fossils! Pollen and foraminifera
What are the possible proxies that provide the records on the graphs? Ice volume: oxygen isotopes in benthic foraminifera Sea surface temperatures: faunal distributions of planktic foraminifera, Mg/Ca ratios in planktic foraminifera, alkenones (specific organic compounds) in coccolithiphores How well do the records match?
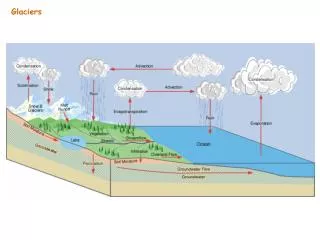
Data can be compared with models to better understand effects of large ice sheets on land and water temperatures
What should the climate be like in Europe during a glacial period in terms of temperature and precipitiation? COOL AND DRY What type of plants would thrive in such conditions? GRASSES What kind of vegetation dominates (or should dominate) Europe today? TREES What should the pollen record from Europe look like?
Model output supporting evidence for cooler glacial period temperatures in continental Europe
Trends in glacial-interglacial pacing • There are important shifts over the last 2.75 million years in the dominance of different orbital cycles over the glacial cycles • As background to this discussion: • How has the intensity of the glacial cycles changed over the last 2.75 million years? • When did the shift to the most intense glaciations occur?
What information is contained in this graph? 1) Long term cooling trend -before 2.75 Ma, what is cooling? 2) 2.75 – 0.9 Ma: 41 ka and 23 ka cycle present, 41 ka dominates 3) 0.9 – 0 Ma: Increased swings in climate, 100 ka cycle dominates
What are rapid deglacial events called? Glacial terminations Based on the graph, form a hypothesis for what is driving glacial terminations? Test your hypothesis
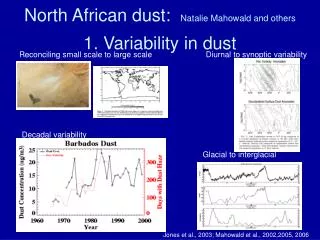
We observe glacial terminations recorded not only by benthic foraminifera, but also by other proxies Glacial terminations are global phenomena – see them in evidence from both hemispheres
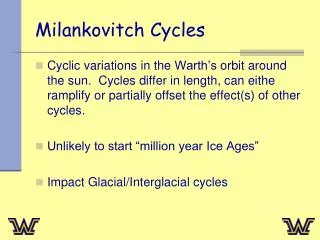
Where does the 100 ka cycle come from? • The Earth cooling past a threshold value? • If cools enough, just the peaks that are approximately 100 ka apart would cause interglacials (Fig. 11-15) • Spacing between interglacials would then be in increments of 23ka (92 ka or 115 ka) • Actual spacing between last five terminations is 116 ka, 117 ka, 94 ka, and 84 ka. • Definitely plausible, but not confirmed • Problem – response to insolation forcing is not linear
Where does the 100 ka cycle come from? • Ice interactions with bedrock? • Isostacy one potential mechanism • Models in the 80’s and 90’s showed that if you modeled the growth and decay of ice sheets and included the isostatic response time of the lithosphere (tens of thousands of years both before and after ice growth and decay), a 100 ka cycle emerged • Ruddiman doesn’t give this much attention • The modelers currently working on this subject don’t agree
Where does the 100 ka cycle come from? • Basal sliding? • When ice sheets move over soil/soft rock covered areas, they stay thin and potentially more fast moving because they can slide • When ice sheets move over bedrock, there is more friction and they can get much thicker and slower moving • Support? The glacial debris deposited before ~1 ma in the North Atlantic dominated by ancient soils and after ~1 ma dominated by bedrock
The Last Glacial Maximum • ~ 20 ka ago • A great part of Earth’s climate record to do Data-Model comparisons • Why? • Models of LGM have different boundary conditions • Ice sheets • CO2 level
Prediction of models: Split Jet Stream, Clockwise winds around ice sheets
Data from CLIMAP (Climate Mapping and Prediction Project, started in the 70’s) support the model results
US Southwest at LGM • Where does the modern sub-polar jet come onshore in N. America? • Where did it come onshore according to model predictions during the LGM? • How would this affect the climate of the southwest? Of the Pacific northwest?