Download
1 / 17
170 likes | 180 Views
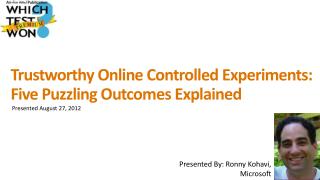
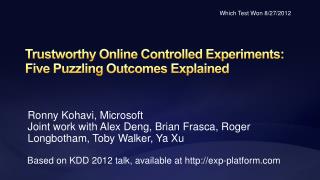
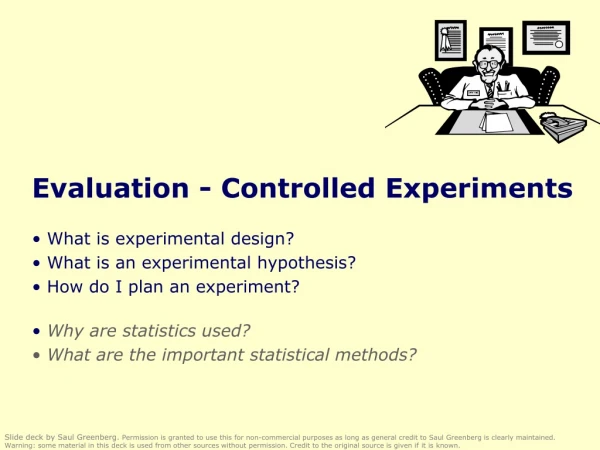
Trustworthy Online Controlled Experiments: Five Puzzling Outcomes Explained. Ronny Kohavi with Alex Deng, Brian Frasca, Roger Longbotham, Toby Walker, Ya Xu. Slides available at http://exp-platform.com. MSN Real Estate. “Find a house” widget variations

E N D
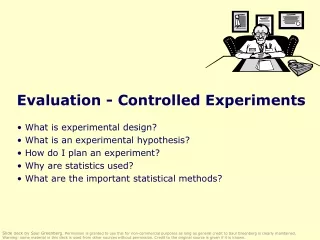
Trustworthy Online Controlled Experiments: Five Puzzling Outcomes Explained Ronny Kohavi with Alex Deng, Brian Frasca, Roger Longbotham, Toby Walker, Ya Xu Slides available at http://exp-platform.com
MSN Real Estate • “Find a house” widget variations • Overall Evaluation Criterion: Revenue to Microsoft generated every time a user clicks search/find button A B • Raise your right hand if you think A Wins • Raise your left hand if you think B Wins • Don’t raise your hand if you think they’re about the same
MSN Real Estate • A was 8.5% better (those who raised their right hand) • Since this is the #1 monetization for MSN Real Estate, it improved revenues significantly • Actual experiment had 6 variants • There was a “throwdown” (vote for the winning variant) and nobody from MSN Real Estate or Zaaz (the company that did the creative) voted for the winning widget • This is very common: we are terrible at correctly assessing the value of our own ideas/designs • At Bing, it is not uncommon to see experiments that impact annual revenue by millions of dollars, sometimes tens of millions of dollars
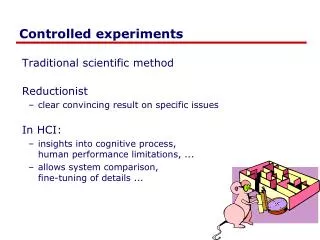
Controlled Experiments in One Slide • Concept is trivial • Randomly split traffic betweentwo (or more) versions • A/Control • B/Treatment • Collect metrics of interest • Analyze • Unless you are testing on oneof largest sites in the world, use 50/50% (high stat power) • Must run statistical tests to confirm differences are not due to chance • Best scientific way to prove causality, i.e., the changes in metrics are caused by changes introduced in the treatment(s)
Puzzle 1: OEC for Search • An OEC is the Overall Evaluation Criterion • It is a metric (or set of metrics) that guides the org as to whether A is better than B in an A/B test • In prior work, we emphasized long-term focus and thinking about customer lifetime value, but operationalizing it is hard • Search engines (Bing, Google) are evaluated on query share (distinct queries) and revenue as long-term goals • Puzzle • A ranking bug in an experiment resulted in very poor search results • Distinct queries went up over 10%, and revenue went up over 30% • What metrics should be in the OEC for a search engine?
Puzzle 1 Explained • Degraded (algorithmic) search results cause users to search more to complete their task, and ads appear more relevant • Analyzing queries per month, we have where a session begins with a query and ends with 30-minutes of inactivity. (Ideally, we would look at tasks, not sessions). • Key observation: we want users to find answers and complete tasks quickly, so queries/session should be smaller • In a controlled experiment, the variants get (approximately) the same number of users by design, so the last term is about equal • The OEC should therefore include the middle term: sessions/user
Puzzle 2: Click Tracking • A piece of code was added, such that when a user clicked on a search result, additional JavaScript was executed(a session-cookie was updated with the destination)before navigating to the destination page • This slowed down the user experience slightly, so we expected a slightly negative experiment. • Results showed that users were clicking more! Why?
Puzzle 2: Click Tracking - Background • User clicks (and form submits) are instrumented and form the basis for many metrics • Instrumentation is typically done by having the web browser request a web beacon (1x1 pixel image) • Classical tradeoff here • Waiting for the beacon to return slows the action (typically navigating away) • Making the call asynchronous is known to cause click-loss, as the browsers can kill the request (classical browser optimization because the result can’t possibly matter for the new page) • Small delays, on-mouse-down, or redirect are used
Puzzle 2: Click Tracking Explained • Click-loss varies dramatically by browser • Chrome, Firefox, Safari are aggressive at terminating such reqeuests. Safari’s click loss > 50%. • IE respects image requests for backward compatibility reasons • White paper available on this issue here • Other cases where this impacts experiments • Opening link in new tab/window will overestimate the click deltaBecause the main window remains open, browsers can’t optimize and kill the beacon request, so there is less click-loss • Using HTML5 to update components of the page instead of refreshing the whole page has the overestimation problem
Background: Primacy and Novelty Effects • Primacy effect occurs when you change the navigation on a web site • Experienced users may be less efficient until they get used to the new navigation • Control has a short-term advantage • Novelty effect happens when a new design is introduced • Users investigate the new feature, click everywhere, and introduce a “novelty” bias that dies quickly if the feature is not truly useful • Treatments have a short-term advantage
Puzzle 3: Effects Trend • Given the high failure rate of ideas, new experiments are followed closely to determine if new idea is a winner • Multiple graphs of effect look like this • Negative on day 1: -0.55% • Less negative on day 2: -0.38% • Less negative on day 3: -0.21% • Less negative on day 4: -0.13% • The experimenter extrapolates linearlyandsays: primacy effect. This will be positive in a couple of days, right? • Wrong! This is expected
Puzzle 3: Effects Trend • For many metrics, the standard deviation of the mean is proportional to , where is the number of users • As we run an experiment longer, more users are admitted into the experiment, so grows and the conf interval shrinks • The first days are highly variable • The first day has a 67% chanceof falling outside the 95% CIat the end of the experiment • The second day has a 55% chanceof falling outside this bound.
Puzzle 3: Effects Trend • The longer graph • This was an A/A test, so the true effect is 0
Puzzle 4: Statistical Power • We expect the standard deviation of the mean (and thus the confidence interval) to be proportional to , where is the number of users • So as the experiment runs longer and more users are admitted, the confidence interval should shrink • But there is a graph of therelative confidence interval sizeforsessions/User over a month • It is NOT shrinking as expected
Puzzle 4: Statistical Power • The distribution is impacted by these factors • Users churn, so they contribute zero visits • New users join with fresh count of one • We have a mixture • The conf interval of the percent effect is proportional to Std-dev/mean/ Most of the time, std-dev/Mean is constant, but for metrics like Sessions/UU, it grows as fast as ,as the graph shows • Running an experiment longer does not increase statistical power for some metrics • You must increase the variant sizes
Puzzle 5: Carryover Effects • Experiment is run, results are surprising.(This by itself is fine, as our intuition is poor.) • Rerun the experiment, and the effects disappear • Reason: bucket system recycles users, and the prior experiment had carryover effects • These can last for months! • Must run A/A tests, or re-randomize
Summary • OEC: evaluate long-term goals through short-term metrics • The difference between theory and practice is greater in practice than in theory • Instrumentation issues (e.g., click-tracking) must be understood • Carryover effects impact “bucket systems” used by Bing, Google, and Yahoo require rehashing and A/A tests • Experimentation insight: • Effect trends are expected • Longer experiments do not increase power for some metrics. Fortunately, we have a lot of users