Download
1 / 28
290 likes | 563 Views
Electronic Data Collection. Colin S. Campbell Ph.D. Research Scientist Decagon Devices, Inc. Outline. Data collection for the early scientist Progress toward modern field techniques Converting electronics into information Electrical Engineering meets the scientist

E N D
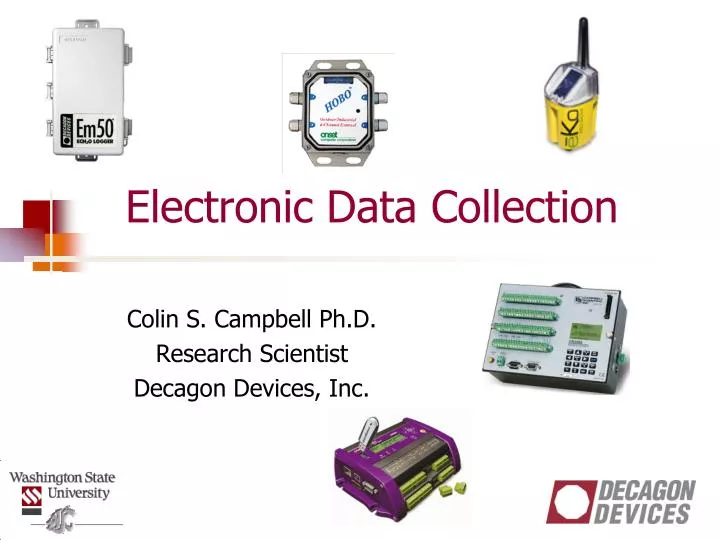
Electronic Data Collection Colin S. Campbell Ph.D. Research Scientist Decagon Devices, Inc.
Outline • Data collection for the early scientist • Progress toward modern field techniques • Converting electronics into information • Electrical Engineering meets the scientist • Assessing the requirements of a project • Making the right system choice
Field research: Quantify physical environment • Early pioneers in environmental biophysics • Howard Penman at Rothamsted Research Station • Manual readings or strip chart/disk recordings • Sleepless nights • Seminal paper on evapotranspiration • Champ Tanner at U. Wisconsin • Travel trailer
Changing world of measurements • There’s got to be a better way • All-nighters at research site not terribly popular • Miss fast changes or events with human sampling • No control of processes • Goals • Make unattended measurements • Store measurements for analysis later • Transform data into information and understanding
Requirements for field research • Possible needs • Sensors that generate electrical signals that can be correlated with environmental phenomena • System to read electronic signals and store them • Make decisions based on measurements • Control external systems based on analysis
Modern field research • Sensors • No limit to parameters that can be measured • Passion for instrumentation design • Only challenge is to find correlations • Indirect measurements • Measuring one parameter and inferring the one of interest • Data logger • Basically glorified multimeter and oscilloscope • Repository for raw sensor output • Interprets electronic signals and stores them
Evolution of measurement: Temperature example • First automation by strip chart recorder • Change in temperature of bimetallic strip • Deflection calibrated to known temperatures • Temperature variation changed pen position • Ink recorded changes over time • Data evaluated by hand • Widely used
Conversion to an electrical signal: The thermocouple • Seebeck effect • Two dissimilar metals jointed together produce voltage potential when differentially heated • Potential related to temperature difference • Correlation (copper-constantan thermocouple) ~ 40 mV per oC • Measurement of minute voltage changes provides accurate temperature • Assuming know the temperature of one junction • Electrical measurement is accurate
Other measurement techniques: Temperature • Thermocouple limitations • voltage accuracy requirement • reference temperature • Alternatives • Thermistor, platinum resistance thermometer • Change electrical resistance with temperature • Diode • Voltage drop across a PN junction
Sensor signal types • Four general types of electronic sensor output • Voltage • Probably the most common type • Includes thermocouples, radiation sensors, some anemometers, etc. • Current • Often used over long cable distances • Common to some measurement and control industries • Pulse or switch closure • Rain gauge, some anemometers, some soil moisture sensors, etc. • Digital • Typical of sensors measuring more than one parameter • Allows for more than one signal per input location
Data logger types • Plug and play (P&P) • Decagon Em50, Em5b • Onset Hobo • CrossBoweKo • Measurement and Control Systems (MCS) • Campbell Scientific CR1000, 3000, etc. • DataTaker DT80 • National Instruments LabView
Choosing a data logger: Things to consider • What electronic outputs do you need to measure? • Voltage, current, pulse, digital • How many sensors are you putting at each research site? • How often will you be storing a measurement?
Choosing a data logger: Things to consider • Will some measurements need to be made more often than others? • >10 Hz (i.e. eddy covariance) • 1 minute (i.e. radiation) • Do you need to control anything with your system (lights, heater, valve, etc.)? • Do you have the time or resources to program and setup the system?
Choosing the right system No Yes No Yes
P&P MCS P&P MCS P&P MCS P&P MCS
Choosing a data logger Plug-and-play data logger • Built for specific sensor measurements or specific sensor types • Allow only a minimum of configuration • Date/time • Measurement interval • Sensor type • Limited sensor inputs • Low flexibility for sensor types
Plug-and-play data loggers Advantages • Fast configuration • Simple deployment • No/low programming complexity • Simple data collection and analysis • Straight-forward sensor integration • Low power consumption • Price Disadvantages • Limited sensor types • Limited input ports • Little or no configurability • No event-based sampling • No/little external control
Choosing a data logger Measurement and control systems (MCS) • Build for general purpose measurement • Measure most types of voltage, current, pulse, and digital sensors • Highly configurable • Many different measurement and control option • Programming allows for multiple measurement intervals • On board data processing and decision making • High speed measurement • Expandable • Add additional sensor capacity • Accurate • May utilize high resolution signal processing for accuracy
Measurement and Control Systems Advantages Disadvantages Programming Configuration Installation and setup Power • Configurability • Precision and accuracy • Programmability • Speed • Decision making and control • Data processing
Characteristics to evaluate • Required resolution and range • Thermocouple • 0.1o C resolution = 4 mV data logger resolution • 50o C range = 2000 mV data logger range • Water content sensor • 0.1% VWC ~ 1 mV data logger resolution • 100% VWC ~ 1000 mV data logger range • Excitation • Many sensors require a voltage be provided to the sensor • Decagon EC-5 – 2.5 or 3V regulated • Gill WindSonic anemometer – 12V unregulated • Excitation requirements vary mV to 10s of volts • Many data loggers have limited excitation options
Characteristics to evaluate (cont.) • Analog to digital converter (ADC) • Voltage and current measurements are made by an ADC • Precision of ADC defines accuracy of the measurement • Defined by bits • i.e. 12 bit ADC 0 to 4095 2.5 V range 0.61 mV/bit • Obviously not good enough for the thermocouple, but good for VWC • 24 bit ADC 0 to 16777216 2.5 V range 0.15 mV/bit • Good enough for thermocouples • Noise rejection • Multiple sources of ambient electrical noise • 60 cycle from electricity, radio frequency
Data logger applications • Making the decision • Many choices available • Sometimes confusion trying to decide which one will work the best • Discuss some applications from personal experience • Caveat: Vast majority of my experience is with Decagon and Campbell Scientific data logger • Many other manufacturers that you may consider • Delta-T, Onset, DataTaker, Stevens, Unidata, etc.
Rice net carbon exchange Conditional sampling • Stored 77 different outputs • CO2, H2O concentration (voltage output from IRGA) • Pyranometer, quantum sensor, net radiation (mV) • Water content (pulse count) • Rain gauge (pulse count) • 3-D sonic anemometer (digital) • Data downloaded by cell phone (2.5 h away) • 5 Marine batteries charged by 6-12V solar panels • 2 CR10X dataloggers, 2 MUX, Relay driver • Flexibility, control, programmability, storage, communication
Turf grass watering Turf field with pop-up sprinklers Decision: things to consider P&P data logger Easy to read VWC sensors Fast installation Low power requirements Data easily collected and graphed over radio or cell phone Often lack control capability MCS Required for system control Large sensor input capacity • Control based on distributed water content sensors • VWC at several locations • Threshold values control solenoid values for sprinklers
Distributed field analysis of physical and morphological interactions Site description System choice Plug-and-play logging system well suited for distributed networks Small number of sensors at each site Radio or cell phone communications Fast setup Low power use No requirement for control or specialized sampling • 37 ha research farm • Large topographical variation • Goal • Investigate water, temperature, and EC variation in relation to soil morphology • 42 distributed profiles • Measurement at 5 depths
Fast, simple plot measurements Description Considerations P&P systems require no programming No specialized sample timing or control Self contained loggers require no enclosure setup or external power • Goal • Compare performance of drought tolerant cultivars • Requirements • Soil moisture, temperature in plots • Weather station parameter in central location • Simple deployment
Summary • Data loggers simply measure and store electronic signals • Art of instrumentation is to dream up new ways or correlating electronics to science • Data logger choices are numerous • Carefully determine all experimental needs • Evaluate system specifications