Download
1 / 18
180 likes | 351 Views
Analysis and simulation of reactive transport of metal contaminants in ground water in the Pinal Creek Basin, Arizona. Dan Portlock Environmental Engineering NDSU Geol 628 Geochemistry 12/1/10. Introduction Background information on Pinal Creek mining

E N D
Analysis and simulation of reactive transport of metal contaminants in ground water in the Pinal Creek Basin, Arizona Dan Portlock Environmental Engineering NDSU Geol 628 Geochemistry 12/1/10
Introduction • Background information on Pinal Creek mining • Background information on Advection and Transport Modeling • Advection and Transport Modeling using Phreeqc • Compare current and present modeling • Conclusion
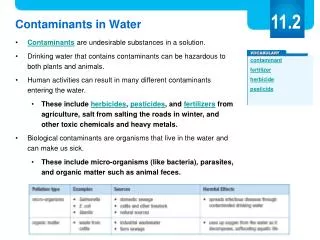
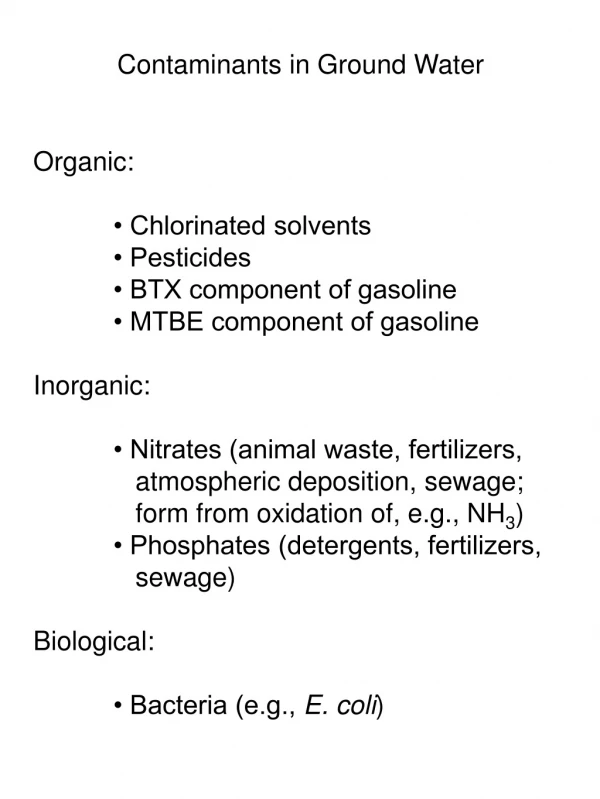
Introduction • Large scale mining activities generated a plume of acidic ground water more than 15 km long in the aquifer of the Pinal Creek Basin • In 1984, the acidic part of the plume had a pH as low as 3.4 and contained milligram-per-liter concentrations of iron, copper, aluminum and other metals. • Contaminant sources include mine tailings, heap-leach areas, surface impoundments of water associated with mining processes and occasional spills of contaminated water into streambeds.
Pinal Creek Wells Table 1 Measured water chemistry of wells along simulated flow path, Pinal Creek Basin, 1984–1990 Values are in mmol/l except for pH. Dashes indicate no data; PCID, Pinal Creek at Inspiration Dam; TIC, total inorganic carbon.
Advection (http://wwwbrr.cr.usgs.gov/projects/GWC_coupled/phreeqc)
Advection Model • Number of cells or sample points • Solutions that needs to be output
Transport (advection and dispersion) • Distance between sample points • Dispersivity between sample points • Number of shifts (pore volumes) • Time step • Boundary conditions • Direction of flow
Conclusions • The advection model is a quick and simple method for analyzing the transport of metals or other contaminants in a system • -It does not account for the distance traveled or the reaction that occurs which could lead to problems when analyzing a more complex system. • The transport model includes dispersion and reaction time which will provide a more detailed analysis of a system. • -The parameters in the transport model are sometimes hard to estimate which could lead to errors.
References • Brown, James., Analysis and simulation of reactive transport of metal contaminants in ground water in Pinal Creek Basin, Arizona 1997. Journal of Hydrology 209, 225-250. • Brown, J.G., Eychaner, J.H., 1996. Research of acidic contamination of ground water and surface water, Pinal Creek Basin, Arizona. In: J.G. Brown and B.O. Favor, (Editors), Hydrology and geochemistry of aquifer and stream contamination related to acidic water in Pinal Creek Basin near Globe, Arizona. US Geological Survey Water-Supply Paper 2466, pp. 1–20.
Questions • Thank you