Download
1 / 24
240 likes | 331 Views
The Wallers Haven Water Resource Assessment Chris Manning - Sussex Area Water Resources Team. Summary. Introduction to CAMS Water Balance Approach Level dependent environment spreadsheet Results Conclusions. Introduction.

E N D
The Wallers Haven Water Resource Assessment Chris Manning - Sussex Area Water Resources Team
Summary • Introduction to CAMS • Water Balance Approach • Level dependent environment spreadsheet • Results • Conclusions
Introduction • Wallers Haven water resource assessment - part of Cuckmere & Pevensey Levels CAMS • CAMS - Catchment Abstraction Management Strategy • “A shared strategy for the sustainable management of water resources within a catchment”
Key aims of CAMS • Make more information publicly available on water resources and abstraction licensing decisions • Consistent and structured approach to local water resources management - recognising needs of abstractors and water environment
Continued... • Opportunity for greater public involvement in the process of managing abstraction • Framework for managing time-limited licences • Facilitate licence trading
The CAMS Process - Key Elements • Pre-consultation • Resource assessment - define resource availability status • Sustainability appraisal • Consultation • Final strategy
Links to other documents & initiatives NationalWater Resources Strategy Vision national supporting document Vision Policy Issues Values Regional WaterResourcesStrategy Local Aspirations Environment Vision Issues Agency Strategies FAP’s CFMPs RSA, HD, WLMPs Create a better place Policy Issues Catchment Abstraction Management Strategy Aspirations
Resource Assessment - Introduction • Pevensey Levels managed according to water levels • Not possible to apply the standard RAM methodology - based on flows • Water balance approach adopted • Change in storage = (Rainfall + Streamflow + Pumped inflow from low level) – (ET + Abstraction + Seepage + Feed to low level + Output to sea)
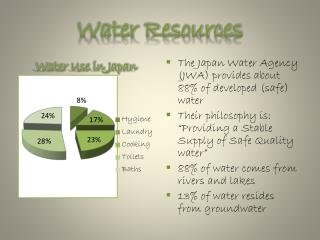
Inputs • Rainfall - MORECS data • Streamflow - Boreham Bridge & Low Flows 2000 • Pumped inflow from low level system - Level Dependent Management Unit (LDMU) spreadsheet (Entec, 2005)
Inputs - LDMU spreadsheet • Considers maintenance of ditches at 0.6m and 0.3m from surface in winter and summer - recommendations through WES • Monthly rainfall and PET time series entered (MORECS). • Low - high & high - low water transfers calculated
Outputs • PET -Loss from Wallers Haven (MORECS) • Abstractions -Fully licensed scenario assumed,Hazards Green surface water - 4500 Ml/yr, 17Ml/d • Seepage - estimate based on Darcy’s Law • Feed to low level - Monthly transfer rate from LDMU spreadsheet
Outputs • Output to sea -Typicalwinter & summer gate levels 2.02m AOD & 2.89m AOD - multiplied by dimensions of Wallers Haven to yield volumes of 343.4 and 491.3 Ml respectively. Subtract these from net volumetric input.
Results - sum of components (over 12 years) • Stream flow: 311415.79 Ml • Rainfall: 1677.78 Ml • Moorhall Stream: 17975.52 Ml • Input to high level: 2685.98 Ml • Output to low level: 8404.07 Ml • PET (high level carrier): 1230.26 Ml • Abstraction: 54000 Ml • Seepage: 58.01 Ml • Outflow to sea: 246809.01 Ml • Summary of inputs: 333755.07 Ml • Summary of outputs: 327859.47 Ml
Results • At the beginning of each year in the flow record volume entering the Wallers Haven above that required to fill to capacity was calculated. • If excess of water above this requirement exists for January and each proceeding month, the Wallers Haven remains full to capacity. • In such a case, the net input for each proceeding month is potentially licensable.
Results • There are cases where for summer months outputs exceed inputs - thus no water potentially available for licensing & net loss from stored volume. • In each of these instances proceeding autumn surplus restores Wallers Haven to full capacity & provide volume potentially available for licensing.
Results - Average surplus per month (potentially licensable)
Conclusions • For the vast majority of months inputs > outputs. • This surplus is typically in excess of that required to fill the Wallers to capacity - thus providing an amount potentially available for licensing. • This surplus has been averaged for each month over the record to produce a monthly value potentially available for licensing.