Download

1 / 33
330 likes | 448 Views
Return to Competitive Pay Pricing For the Class III Formula. Daniel Smith, Esq. Special Counsel, MDIA Ryan Miltner, Esq. Counsel, DPNM Paul Christ Consultant, MDIA. History of Competitive Pay Pricing. 1961: Department adopts the M-W Pricing Series 1994: Department replaces M-W with BFP

E N D
Return to Competitive Pay Pricing For the Class III Formula Daniel Smith, Esq. Special Counsel, MDIA Ryan Miltner, Esq. Counsel, DPNM Paul Christ Consultant, MDIA
History of Competitive Pay Pricing • 1961: Department adopts the M-W Pricing Series • 1994: Department replaces M-W with BFP • declines to adopt end product pricing formula • 1996 - 2000 FAIR ACT Milk Market Order Reform: Department adopts end product pricing • rejects competitive pay pricing • 2007: MDIA Proposes Replacement of End Product Pricing with Competitive Pay Pricing
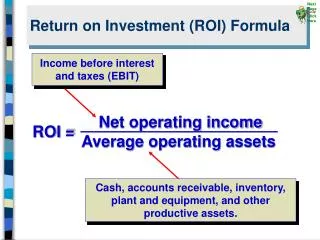
How Would This Competitive Premium be Used? • Average competitive pay price would become the new Class III price. • No change in protein or butterfat pricing. • The other solids price would represent the residual value of the competitive pay price. • The new Class III price would be one of the “higher of” values used to set Class I prices. • Purchases of milk in competitive areas would be deregulated.
Part 1 Defining the Competitive Zones
How to Define Competition • We chose to use the Herfindahl-Hirschman index (HHI). • Used by the U. S. Department of Justice in antitrust enforcement.
Competitive Zone Definition 1 Representation of Most Competitive 25% Regional Production of Milk, By County (FMMOs)
Counties in FMMO Regions With Most Competition For MilkComprising 25% of Region’s Milk Production (Dec 2008)
Map/Data Set SummaryLargest County-Level HHIBy Milkshed, Up to 25% of Pooled Milk
Competitive Zone Definition 2 Establish Governing Herfindahl Index of .33
Central RegionMilkshed Counties with HHI of .33 or less, and Representing 17.85% of Pooled Milk (Dec ’08)
Mideast Region Milkshed Counties with Lowest HHI Comprising 25% of Pooled Milk (Dec ‘08)
Northeast RegionMilkshed Counties with Lowest HHI Comprising 25% of Pooled Milk (Dec ‘08)
Northwest RegionMilkshed Counties with HHI Less Than .33Comprising Some Portion of Pooled Milk (Dec ‘08) None Reported
Southeast MilkshedMilkshed Counties with HHI of .33 or less, and Representing Some Amount Less than 10.33% of Pooled Milk (Dec ’08)
Southwest MilkshedMilkshed Counties with HHI of .33 or less, and Representing Some Amount Less than 3.55% of Pooled Milk (Dec ’08)
Upper MidwestMilkshed Counties with Lowest HHI Comprising 27.64% of Pooled Milk (Dec ‘08)
Part 2 Impact Analysis
FMMO Pooled Milk Production (Bil. Lbs)and Percentage By Region
Does Competition Make a Difference? • We compared blend prices for the largest competitive county in each region to mailbox prices for 36 months. We found consistent premiums. • We asked the Market Administrators to compare the Federal Order statistical uniform price (at test) to gross payments to producers in the competitive counties. • Any differences were weighted by milk volume and averaged to represent the region.
Competitive Counties Weighted Difference by MilkshedDecember 2008 • Milkshed NameDifference • Central $1.22 • Mideast $1.02 • Northeast $1.10 • Northwest no data • Southeast $1.09 • Southwest ($0.72) • Upper Midwest $1.14
National Impact • We have competitive data for six of the seven Federal Order regions. These represented 93.71 percent of Federal Order milk in 2010. • Using the premiums (and discounts) paid in the qualifying competitive counties in these regions, and weighting them by regional milk volume, the December 2008 premium was $.89.
Impact of the New Price on Buyers • The Class III price would go up. This would not affect cheese makers in competitive areas, because they will no longer be subject to Federal Order minimum prices, and most are already paying premium prices. • Cheese makers who are outside the competitive areas will be subject to higher minimum Class III prices. • The Class I price would go up whenever the Class III price drives the Class I price.
Impact of the New Price on Producers • The Federal Order blend price would go up as both the Class I and Class III prices went up. • Producers in competitive areas (the Upper Midwest) would get about the same prices, since they already get the premiums. • Producers outside the competitive areas would likely get more than they now do. • The Producer Price Differential (PPD) would go down.
What About the Pacific Northwest? • Two Options: 1. Ignore the competitive data for this region because it does not meet the standards of the other regions. 2. Use a special standard for this region. For example, select the largest milk production county among the most competitive 25% of the milk supply (Yakima County, Washington).
Conclusions • It is possible to measure competition in the raw Grade A milk market. • Significant competition does exist in some areas of each Federal Order region (except the Pacific Northwest). • Actual competitive pay prices can be used to set Federal milk order prices.
Measures of Competition • Number of handlers from all orders buying milk in a county. • Herfindahl Index: Market share of each competitor is squared. Market ShareMS Squared Firm 1 .40 .16 Firm 2 .30 .09 Firm 3 .20 .04 Firm 4 .10 .01 Herfindahl Index: .30