Download
1 / 1

E N D
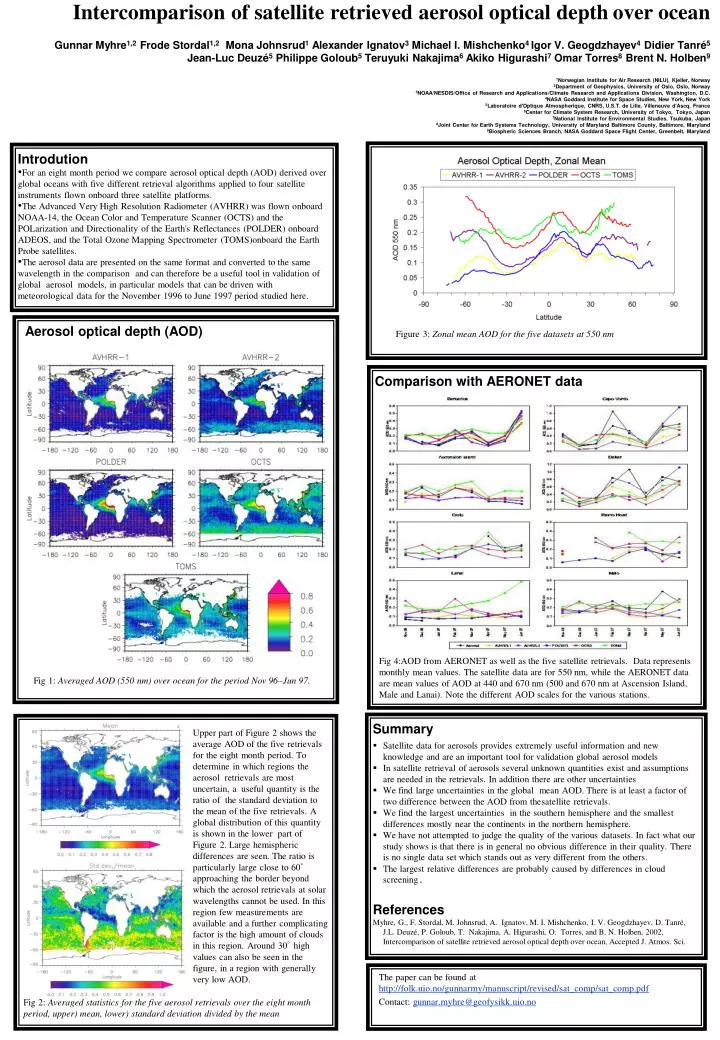
Comparison with AERONET data Intercomparison of satellite retrieved aerosol optical depthover oceanGunnar Myhre1,2 Frode Stordal1,2 Mona Johnsrud1Alexander Ignatov3Michael I. Mishchenko4Igor V. Geogdzhayev4Didier Tanré5Jean-Luc Deuzé5Philippe Goloub5Teruyuki Nakajima6Akiko Higurashi7Omar Torres8Brent N. Holben91Norwegian Institute for Air Research (NILU), Kjeller, Norway2Department of Geophysics, University of Oslo, Oslo, Norway3NOAA/NESDIS/Office of Research and Applications/Climate Research and Applications Division, Washington, D.C.4NASA Goddard Institute for Space Studies, New York, New York5Laboratoire d'Optique Atmospherique, CNRS, U.S.T. de Lille, Villeneuve d'Ascq, France6Center for Climate System Research, University of Tokyo, Tokyo, Japan7National Institute for Environmental Studies, Tsukuba, Japan8Joint Center for Earth Systems Technology, Universityof Maryland Baltimore County, Baltimore, Maryland9Biospheric Sciences Branch, NASA Goddard Space Flight Center, Greenbelt, Maryland Introdution • For an eight month period we compare aerosol optical depth (AOD)derived over global oceans with five different retrieval algorithmsapplied to four satellite instruments flown onboard three satelliteplatforms. • The Advanced Very High Resolution Radiometer (AVHRR) was flown onboard NOAA-14, the Ocean Color andTemperature Scanner (OCTS)and the POLarization andDirectionality of the Earth's Reflectances(POLDER) onboard ADEOS, and the Total Ozone MappingSpectrometer (TOMS)onboard the Earth Probe satellites. • The aerosol data are presented on the same format and converted to the same wavelength in the comparison and can therefore be a useful tool in validation of global aerosol models, in particular models that can be driven withmeteorological data for the November 1996 to June 1997 period studied here. Aerosol optical depth (AOD) Figure 3: Zonal mean AOD for the five datasets at 550 nm Fig 4:AOD from AERONET as well as the five satellite retrievals. Data represents monthly mean values. The satellite data arefor 550 nm, while the AERONET data are mean values of AOD at 440 and 670 nm (500 and 670 nm at Ascension Island, Male and Lanai). Note the different AOD scales for the various stations. Fig 1: Averaged AOD (550 nm) over ocean for the period Nov 96–Jun 97. Summary • Satellite data for aerosols provides extremely useful information and new knowledge and are an important tool for validation global aerosol models • In satellite retrieval of aerosols several unknown quantities exist and assumptions are needed in the retrievals. In addition there are other uncertainties • We find large uncertainties in the global mean AOD. There is at least a factor of two difference between the AOD from thesatellite retrievals. • We find the largest uncertainties in the southern hemisphereand the smallest differences mostly near the continentsin the northern hemisphere. • We have not attempted to judge the quality of the various datasets.In fact what our study shows is that there is in general no obvious difference in their quality. There is no single data set which stands out as very different from the others. • The largest relative differences areprobably caused by differences in cloud screening. • References • Myhre, G., F. Stordal, M. Johnsrud, A. Ignatov, M. I. Mishchenko, I. V. Geogdzhayev, D. Tanré, J.L. Deuzé, P. Goloub, T. Nakajima, A. Higurashi, O. Torres, and B. N. Holben, 2002, Intercomparison of satellite retrieved aerosol optical depth over ocean, Accepted J. Atmos. Sci. Upper part of Figure 2 shows the average AOD of the five retrievals for the eight month period. Todetermine in which regions the aerosol retrievals are most uncertain, a useful quantity is the ratio of the standard deviation to the mean of the five retrievals. A global distribution of this quantity is shown in the lower part of Figure 2. Large hemispheric differences areseen. The ratio is particularly large close to 60°approaching the border beyond which the aerosol retrievals at solar wavelengths cannot be used. In this region few measurements are available and a further complicating factor is the high amount of clouds in this region. Around 30° high values can also be seen in the figure, in a region with generally very low AOD. The paper can be found at http://folk.uio.no/gunnarmy/manuscript/revised/sat_comp/sat_comp.pdf Contact: gunnar.myhre@geofysikk.uio.no Fig 2: Averaged statistics for the five aerosol retrievals over the eight month period, upper) mean, lower) standard deviation divided by the mean