Download
1 / 28
320 likes | 509 Views
Business Process. A logically related sets of tasks or activities geared toward some business outcome. 1. Primary (value-added) 2. Support 3. Developmental. Suppliers Purchasing Engineering Operations Finance Marketing Customers. Developing new products (Chapter 5).

E N D
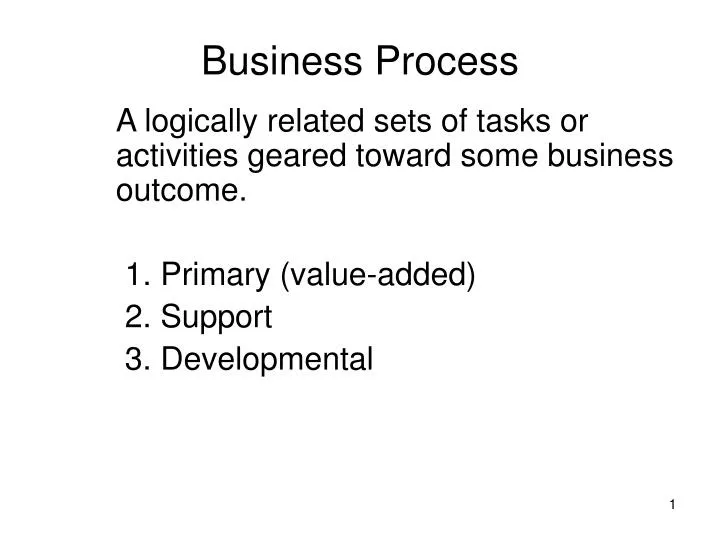
Business Process A logically related sets of tasks or activities geared toward some business outcome. 1. Primary (value-added) 2. Support 3. Developmental
Suppliers Purchasing Engineering Operations Finance Marketing Customers Developing new products (Chapter 5) Evaluating suppliers (Chapter 9) Developing sales & operations plans (Chapter 11) Versus the “functional” Perspective
Start or finishing point Step or activity in the process Decision point (typically requires a “yes” or “no”) Input or output (typically data or materials Document created Delay Inspection Move activity Mapping Symbols Typical, but others may be used as appropriate
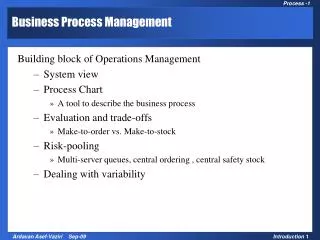
Improving Business Processes: Guidelines • Attack each delay • What causes it? • How long is it? • How could we reduce its impact? • Examine each decision point • Is this a real decision or just a checking activity? • If the latter, can we automate or eliminate it?
More Guidelines • Look for loops • Why is this loop here? • Would we need to loop if we didn’t have any failures in quality, planning, etc? • Process steps • What is the value of this activity, relative to its cost? • Is this a necessary activity (support or developmental?), or something else?
Process Measures • Productivity • Efficiency • Cycle Time • Benchmarking
Outputs Inputs Productivity Measures Productivity = Partial, Multifactor, and Total measures of productivity
Single factor productivity ratio: Multifactor: Total: Batteries Produced Direct Labor Hours Batteries Produced Machine + Direct Labor Hours Total Nightly Sales ($) Total Nightly Costs Examples
Efficiency A comparison of a company’s actualperformance to some standard • Usually expressed as a percentage • Standard is an estimate of what should be produced based on studies or historical results • Efficiency = 100%(actual/standard)
Cycle Time The total time required to complete a process from start to finish. The percent of cycle time spent on value-added activities is a measure of process effectiveness.
Cycle Time Drivers Causes that increase cycle time are: • Waiting times • Unneeded steps • Rework • Unnecessary controls or testing • Outmoded technology • Lack of information or training
Benchmarking A comparison of a company’s performance to the performance of: • Other firms in its industry(strategic) • Firms identified as “world-class” (process)
Classic Mfg. Process Types(in order of decreasing volume) • Continuous Flow • Production Line (Flow Line) • Batch (High Volume) • Batch (Low Volume) • Job Shop • Project
Continuous Flow • Large production volumes • High level of automation • Basic material passed along, converted as it moves • Usually very high fixed costs, inflexible Oil refinery, fiber formation, public utilities
Production Lineaka Flow Line and Repetitive Manufacturing High-volume production of standard products or “design window” • Processes arranged by product flow • Often “paced” • Highly efficient, but not too flexible
Batch I • Somewhere in between job shop and line processes • Moderate volumes, multiple products • Production occurs in “batches” • Garment manufacturing, carton makers, etc.
Batch II Layout is a cross between that found in a line and that found in a job shop: Group Technology
Job Shop • Low volume, one-of-a-kind products • Job shops sell their capability • Highly flexible equipment, skilled workers • Equipment arranged by function
Project • Used when a product is: • one-of-a-kind • too large to be moved • Resources moved to where needed • Equipment, people, etc. are highly flexible • Finite duration, often with deadline Building projects, equipment installation
Mixing Together the Process Types ... Spindles ASSEMBLY LINEfor putting together final product Arms and Legs BATCH for fabricating parts ... Seats
Product – Process Matrix Very Poor Fit Very Poor Fit
Life-Cycle Planning Framework • Centralized • inventory • Speed • Availability • Achieve break- • even volumes • as soon as • possible • Less need • for flexibility • High • product • availability • Flexibility • to handle • variation More selective, targeted efforts Value-added service
What is “Customization”? “Customization occurs when a customer’s unique requirements directly affect the timing and nature of operations and supply chain activities”
Customization Point Model Definitions: ETO – engineer to order MTO – make to order ATO – assemble-to-order MTS – make to stock
Layout Decision Models • Product-based layout • Usually best for a line operation • Cycle time a primary measure • Functional (Process-based) layout • Usually best for a job shop • Distance between steps a measure • Cellular layout • Usually best for batch processes