Download
1 / 48
490 likes | 863 Views
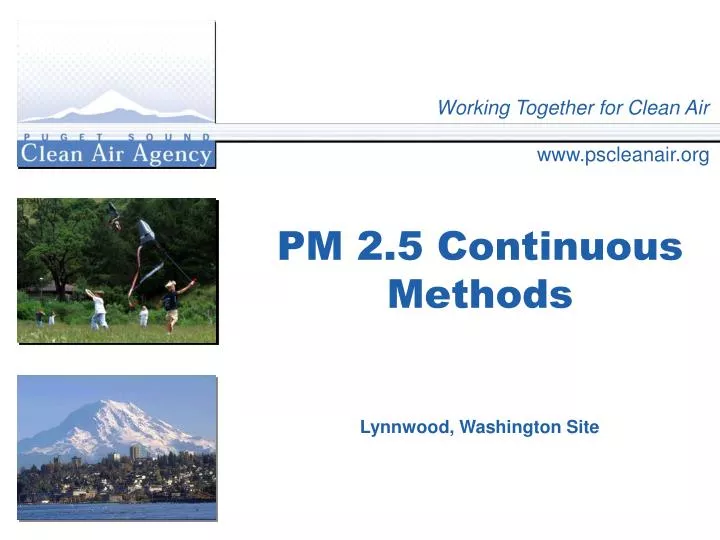
PM 2.5 Continuous Methods. Lynnwood, Washington Site. Study Objectives. To share information regarding Continuous Fine Particle Monitoring vs the Federal Reference Method for PM 2.5 at a Woodsmoke Impacted Site

E N D
PM 2.5 Continuous Methods Lynnwood, Washington Site
Study Objectives • To share information regarding Continuous Fine Particle Monitoring vs the Federal Reference Method for PM 2.5 at a Woodsmoke Impacted Site • To specifically compare the technologies employed by vendors in continuous fine particle monitoring • To assist us in Long Term Network Management Decisions • Which Device (s) should we invest in for future Fine Particle Monitoring for Woodsmoke Impacted Areas?
Abstract • The Puget Sound Clean Air Agency has a long history of using continuous fine particle monitors in the Seattle Metropolitan Area. In an ongoing continuous improvement effort, we have used a site in a wood smoke impacted area to test new technologies for continuous fine particle monitoring. This presentation is a data update studying both the technical data issues of intercomparison and quality assurance, and the practical issues of maintenance and operations between various samplers including the Rupprecht & Patashnik TEOM (tapered element oscillating microbalance), the TEOM FDMS (filter dynamics measurement system), the Radiance Research Nephelometer, and the Met-One 1020 BAM (beta attenuation monitor) and E-BAM. The standard PM 2.5 method that will be used for comparison is the Federal Reference Method.
Lynnwood, Washington Site Lynnwood Site
Detailed Site Description Lynnwood Monitoring Site
2003 Study Design • In 2003, we collected data: • FRM PM 2.5 -- 1 in 6 • TEOM PM 2.5 • Nephelometer PM 2.5 • TEOM FDMS PM 2.5 • Looking for a measure of performance with significant aerosol volatility
2004 Study Design • Look at “Wood Smoke” Season comparing: • FRM PM 2.5 -- 1 in 3 • TEOM PM 2.5 • Nephelometer PM 2.5 • TEOM FDMS PM 2.5 • Met-One BAM PM 2.5 • Met-One E-BAM PM 2.5
Aethalometer Experience • Dual Channel Aethalometer • Project objective: to learn more about nature of Carbon Aerosol • Some Surprising results… • Darrington, WA Sampling Site • High Concentration of Wood Smoke
U. of WashingtonDiesel Exposure LabTesting Aethalometer Pilot Experiment
Opportunity • UW Diesel Exposure Laboratory • Health Studies: Humans and Mice • Principal Investigator – Dr. Joel Kaufman, MD, MPH • Engineering Investigator – Dr. Tim Larson, PHD • Diesel engine • Current model turbocharged direct-injection 5.9 liter Cummins B-series engine (6BT5.9G6, Cummins, Inc., Columbus, IN). 100 kW generator set. • Comparable to delivery trucks and school buses. • Fuel • Fuel is #2 un-dyed on-highway fuel from a commercial source
Visual 30x20x8 foot chamber with instrumentation Diesel Engine outside: Controlled exposure chamber inside.
Initial Study Questions • What will the Aethalometer measure when we expose it to this Acute, High Pollution Level Environment? • What will the ratio be between the PM 2.5 DPM being measured by the TEOM and the PM 2.5 BC being measured by the Aethalometer? How Variable? • How will the Nephelometer measurements relate to the measurements taken with the other devices? • What will the BC and UV channel show us about the nature of the Diesel Particulate Matter?
Study Objectives • Learn more about both channels of the Aethalometer by testing it in the Diesel Exposure Lab • Learn about the Maximum Limits of the Aethalometer • Learn about the linearity of the Aethalometer over a wide range of exposures • Learn about the relationship between the BC and UV channels • Learn more about the TEOM and NEPH in the Diesel Exposure Lab
Method • Monitored Air in the chamber using TEOM, NEPH, and dual channel Aethalometer at various levels of Total PM 2.5 (in this case, total Diesel Particulate Matter) • Experiment lasted 9 weeks • Gathered data on 7 sessions of opportunity during those 9 weeks • We were able to validate 5 of those sessions (extremely high levels caused instrument malfunction) • Assumption: TEOM is our Standard PM 2.5 device for this experiment. Historically, we have shown that both the TEOM PM 2.5 device, and the Nephelometer have excellent correlations with the PM 2.5 Federal Reference Method.
Time Synch Problem • Time Synch Problem: The instrument’s clocks were not in synch. For analysis, we used the TEOM’s time standard and subjectively adjusted the other devices’ data accordingly to synch the time. • Data Resolution Limiting Factor: Aethalometer 5 minute Averages. • For comparison, we calculated 5 minute average data for all 3 devices.
PSCAA Method to Convert Bscat to PM 2.5 for Ambient Air • We use a wide network of Nephelometers to monitor PM 2.5 in Snohomish, King, Pierce, and Kitsap Counties. • We use a 24 Hour Average Correlation Factor to convert from Bscat to PM 2.5. We have used nephelometer to PM 2.5 Federal Reference Method historical data (24 Hr Averages) to calculate these factors. • Examples:
Neph and TEOM Discussion • The direct linear relationship shown between the Nephelometer and the TEOM indicate that they both detect and measure Diesel Particulate Matter. • Based on the light scattering properties of DPM, there is a different relationship (slope) than what we would see in the ambient atmosphere when more than just DPM is being measured. Particles from other sources have other light scattering properties. • Diesel particles scatter much less light than the ambient PM 2.5 particles that we see in the ambient atmosphere.
Data Sets - Comparisons Neph Bscat Axis
Data Sets - Comparisons Neph Bscat Axis
Data Sets - Comparisons Neph Bscat Axis
Data Sets - Comparisons Neph Bscat Axis
Data Sets - Comparisons Neph Bscat Axis
Diesel Particulate Matter UV/BC Ratio • UV/BC Ratio is a means to qualitatively differentiate between Wood Smoke type Black Carbon and Diesel type Black Carbon. • Examples: • Wood Smoke Darrington Site UV/BC Ratios was 1.93 • Diesel UV/BC Ratio determined by this study 0.76 Darrington Wood Smoke Site Univ Wash Diesel Chamber
Pilot Study Preliminary Findings • When monitoring fine particles from a specific diesel source, the light scattering instrument (Nephelometer) and the light absorption instrument (Aethalometer) yield different results than what we see in the ambient atmosphere. • DPM Particles absorb light at 880 nm. DPM Particles scatter less light than other PM 2.5 particles when measuring with the Nephelometer. • The Aethalometer BC channel does a fairly good job measuring DPM particles in terms of mg/m3 as compared to the PM 2.5 TEOM. • Combined with the knowledge of results at our wood smoke dominated sites, the UV channel does a good job identifying the difference between the wood smoke generated PM 2.5 particles and the DPM generated PM 2.5 particles
Aeth performance – Precision & Accuracy • Aethalometer (s/n 451) Performance Verification: • We co-located another Aeth (s/n 517) for a period of 2 weeks. • Flow Checks Completed to eliminate Flow Inaccuracy from analysis • Evaluated the instrument to instrument precision and accuracy for these two weeks which included 1 high level diesel exposure. • Conclusions: • Precision (R2) within PM 2.5 continuous monitoring standards • Bias (Accuracy) outside normal PM 2.5 monitoring standards (10%) • Unable to Calibrate Device Optics
Maintenance Issues • Federal Reference Method (1 in 3) • Use R&P 2025 Sequential Samplers • Problems with Leak Checks • Going into Stop Mode causes a lot of filter data retrieval and filter exchange problems • R&P TEOM and/or TEOM FDMS (Continuous) • Generally, R&P is very good about Service and Manuals • We spend more time troubleshooting these than what is desirable, but we have had good data completeness numbers. • Radiance Research Nephelometers (Continuous) • Technology and Device very well understood. • Service from Radiance Research lacks • Met-One Beta Attenuation Monitors (Semi-Continuous) • Met One Service very good • Problems with Leak Checks and Flow Checks • New to us, so we’re getting used to the Software Interfaces.
Summary • 2003 Data suggests that the FDMS (Filter Dynamics Measurement System) sees aerosol that possibly volatilize from other sampling systems • For example: • Nephelometer uses a heated probe to knock out the moisture effects that we see in certain environmental conditions • TEOM is heated to 50° C in Summer and 30° C in Winter to maintain a constant operating temperature for more consistent measurement • FRM is kept near ambient by it’s internal pump, but there could be volatiles that come off the filters before they are weighed in the laboratory.
Summary • All of the devices seem to do a credible job • No one device is perfect! • Determining network decisions • Know the customer • Cost and operation