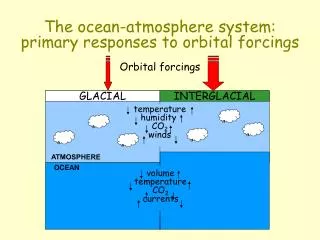
Download
1 / 37
370 likes | 479 Views
Dynamical responses to volcanic forcings in climate model simulations. DynVar workshop 22.04.13 Matthew Toohey with Kirstin Krüger, Claudia Timmreck, Hauke Schmidt. Motivation. What would happen if a large volcanic eruption occurred tomorrow?

E N D
Dynamical responses to volcanic forcings in climate model simulations DynVar workshop 22.04.13 Matthew Toohey with Kirstin Krüger, Claudia Timmreck, Hauke Schmidt
Motivation • What would happen if a large volcanic eruption occurred tomorrow? • Every seasonal to decadal climate forecast made prior to the eruption would become obsolete. Thompson et al. (2009) Thompson et al. (2012)
“Winter Warming” Robock and Mao (1992)
Post-volcanic dynamical anomalies Schmidt et al., 2013 13 eruptions Christiansen, 2008 Baldwin and Dunkerton. 2001
Stratospheric mechanism Stenchikov et al. (2002)
Model results • A number of studies have reported realistic simulation of post-volcanic NH dynamical anomalies (Graf et al., 1993, 1994; Mao and Robock, 1998; Kirchner et al., 1999; Shindell et al., 2001; Rozanovet al., 2002; Stenchikov et al., 2002; Collins, 2004; Shindellet al., 2003, Shindell et al. 2004) • But multi-model studies (e.g. CMIP, CCMVal-2) have not produced a convincing picture of model behavior.
CCMVal-2 post-eruption T anomalies Ch. 8 in SPARC, CCMVal Report, 2010
CMIP5 9 eruptions 13 models 72 members 9 eruptions n=18 Sea level Pressure 9 eruptions 13 models 72 members 4 eruptions n=8 50 hPa Geopotential height Driscoll et al. 2012
CMIP5 CMIP5 Low-top High-top ERA-interim Charlton-Perez et al., 2013
Stratospheric mechanism ? ? Stenchikov et al. (2002)
The question • Why don’t CMIP5 models show strong NH winter vortices (i.e., negative polar cap z50 anomalies) after volcanic eruptions? • Either • Response is not real (just chance?) • Models are flawed • Implementation of volcanic aerosol forcing is flawed • Volcanic aerosol forcing is flawed
CMIP volcanic forcings Ammann (2003)/(2007) Sato et al. (1990)/GISS/Stenchikov 0.4 0.3 0.2 0.1 0 Jul 91 Jul 91 Jan 91 Jan 92 Jan 92 Jan 91 Jan 92 Jan 92 • Pinatubo and El Chichon based on SAGE observations • Recently updated with OSIRIS observations Oct 2001 - present • Best estimate sulfur mass injection, distributed via parameterized stratospheric transport model
CMIP Volcanic forcings • Notes: zonal mean, monthly mean, for pre-satellite era eruptions, spatial distribution of aerosols poorly constrained Sato et al. (1990)/GISS/Stenchikov
Experiment • Part 1: • Use MAECHAM5-HAM, a coupled aerosol-climate model, to simulate the evolution of stratospheric sulfate aerosol after a Pinatubo-like eruption. • Part 2: • Use MPI-ESM, a high-top CMIP5 model, and replace the prescribed Pinatubo volcanic forcing from historical simulations with forcing sets built from Part 1.
MPI-ESM • MPI-ESM: full Earth System model, with atmosphere, ocean, carbon cycle, vegetation components. • Atmospheric component ECHAM6. • “low resolution” (LR, T63/L47), configuration used here (no QBO). • Volcanic aerosols are prescribed • CMIP5 historical simulations use Stenchikov et al. (1998) forcing data set -> monthly mean, zonal mean aerosol extinction, single scattering albedo, and asymmetry factor
MAECHAM5-HAM • ECHAM: GCM developed at MPI-M, Hamburg • Middle atmosphere version: 39 vertical levels up to 0.01 hPa (~80 km) • T42 horizontal resolution • Climatological sea surface temperatures, no QBO, no chemistry • HAM: Aerosol microphysical module • Modified for simulation of stratospheric volcanic aerosols • Models aerosol growth, radiative effects, eventual removal HAM Aerosol growth Radiative effects Inject SO2 at 24 km Transport to troposphere, rainout! SO2→ H2SO4 ECHAM5 Aerosol transport via atmospheric circulation
MAECHAM5-HAM Pinatubo simulations Tooheyet al (2011, ACP) • Simulations of 17 Tg eruption, June 15, 15.3°N • Excellent agreement with ERBE TOA SW flux anomalies observed after Pinatubo eruption. • Little to no dependence on eruption longitude.
Modeled aerosol transport months after eruption months after eruption Toohey et al. (2011)
HAM July eruption simulations: DJF1 Temperature Geopotential height Zonal wind n=12
DJF1 z50 anomalies July eruptions April, July and October eruptions n=36 n=12
Weak and Strong vortex composite AOD July eruptions n=12
Vortex strength ~ AOD gradient? Polar cap gph anomaly calculated as area mean over 70-90N. AOD gradient at 60N as AOD(60-90N) – AOD(50-60N)
Vortex strength ~ AOD gradient? Strong Vortex AOD gradient across vortex Aerosol heating gradient? If we want our prescribed aerosols to force a strong vortex, the forcing had better take the form of a strong vortex.
MPI-ESM Pinatubo forcing experiment r1,r2,r3 r4,r5,r6 r7,r8,r9 Stenchikov (CMIP5) HAM weak HAM strong
Aerosol extinction at 550 nm Stenchikov HAM weak HAM strong
MPI-ESM: DJF1 T and u anomalies Stenchikov HAM weak HAM strong Temperature (K) u wind (m/s)
MPI-ESM: DJF1 z50 anomalies Low-top High-top ERA-interim
MPI-ESM: DJF1 z50 anomalies Low-top High-top ERA-interim
MPI-ESM: DJF1&2 z50 anomalies CMIP5 Low-top High-top ERA-interim
Aerosol extinction at 550 nm Stenchikov HAM weak HAM strong
Extinction at 550 nm August Arfeuille et al. ACPD 2013
Volcanic forcing, the next generation • CCMI: Surface Area Densities (SADs), stratospheric heating rates, and radiative properties, based on SAGE_4λ retrievals (Tom Peter and BeipingLuo, ETHZ) • Model-basedaerosol reconstructions becoming available for pre-satellite era eruptions. Tambora: Arfeuille et al. (2013) vs. Crowley (2008)
Conclusions • For a CMIP5 historical-style simulation of Pinatubo, we can control the strength of the (ensemble mean) post-eruption NH winter vortex with the aerosol forcing set • Vortex strength ~ AOD gradient across vortex edge • Likely that dynamical response to volcanic eruptions can be „improved“ by using different forcing data sets. • Future work will show whether new volcanic forcing sets lead to better dynamical responses in climate models.