Download
1 / 14
140 likes | 380 Views
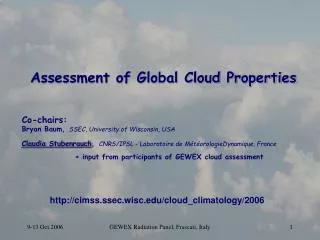
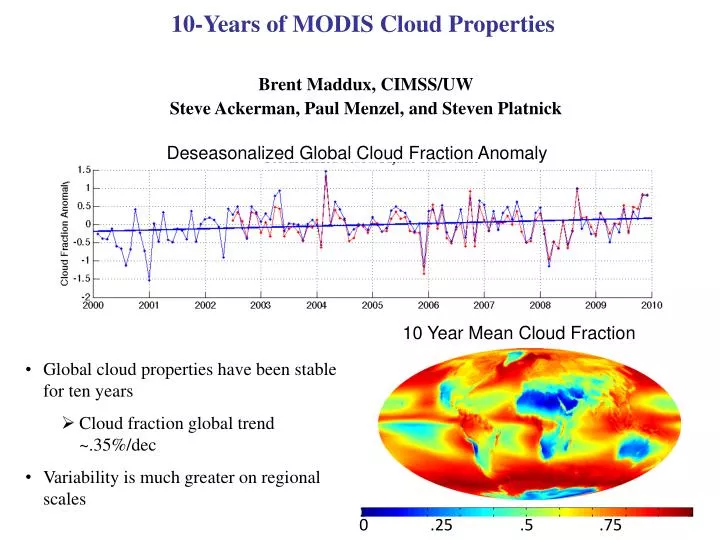
10-Years of MODIS Cloud Properties . Brent Maddux, CIMSS/UW. Steve Ackerman, Paul Menzel, and Steven Platnick. Deseasonalized Global Cloud Fraction Anomaly. 10 Year Mean Cloud Fraction . Global cloud properties have been stable for ten years Cloud fraction global trend ~.35%/dec

E N D
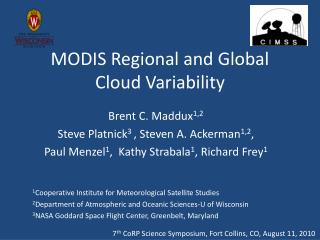
10-Years of MODIS Cloud Properties Brent Maddux, CIMSS/UW Steve Ackerman, Paul Menzel, and Steven Platnick Deseasonalized Global Cloud Fraction Anomaly 10 Year Mean Cloud Fraction • Global cloud properties have been stable for ten years • Cloud fraction global trend ~.35%/dec • Variability is much greater on regional scales 0 .25 .5 .75 1.0
Iterative channel selection based maximizing a figure of merit, the Degrees of Freedom of Signal • A channel is selected if the calculated DFS is maximum when this channel is added. • Increase in information is taken into consideration in the next channel selection • Channel selection trained using potentially convective soundings • 324 most significant channels selected. • 88 overlapping channels • Comparison of analysis and forecast due to the assimilation of the AIRS NRT and the DFS selected channel set. Selecting AIRS Channels for Data Assimilation : An Application for Convective Initiation Forecast Agnes LIM, Allen HUANG, Elisabeth WEISZ, Steve ACKERMAN Cooperative Institute for Meteorological Satellite Studies (CIMSS) AIRS Near Real Time Channels DFS Selected Channels
Validation of Microwave Emissivities of Land Surfaces: Detection of Snow and Surface Matters Narges Shahroudi, NOAA-CREST Advisor: Dr. William Rossow, NOAA-CREST Temp vs.E85V-E85H E19V-E85V E85V-E85H • Objective: Detect Snow Cover using Microwave Emissivity data • Snow cover flag and Vegetation flag was used to separate the emissivity and their behavior at each vegetation has been observed. • A snow cover classification has been proposed.
Towards a Better Monitoring of Soil Moisture Using a Combination of Estimates from Passive Microwave and Thermal Observations Zulamet Vega-Martinez1, Marouane Temimi1, Martha C. Anderson2, Christopher Hain3, Nir Krakauer1, Reza Khanbilvardi1 1NOAA-CREST, City University of New York|2 USDA-ARS-Hydrology and Remote Sensing Lab|3 The University of Alabama in Huntsville • The main objective of this work is to implement a multi-satellite approach which combines soil moisture estimates from passive microwave and thermal observations to improve the monitoring of its variability on a continental scale. • ALEXI mainly uses GOES data to calculate soil moisture in clear sky days on a continental scale. In cloudy days, when visual imagery is affected by clouds, it estimates the soil moisture based on gap filling technique. • This project aims to use AMSR-E product to enhance ALEXI sensitively to soil moisture over cloud covered pixels. A preliminary visualization of the soil moisture products from ALEXI and AMSR-E have been conducted including daily evaluations for the different combinations of data at different regions. Figure 2. ALEXI Average Soil Moisture data at the surface in July 14th , 2003. This data is in inches of water per foot of soil Figure 1. AMSR-E Soil Moisture in July 14th, 2003 (cloudless day of the month). This data is in gcm-3
Lake Ice Phenology Analysis Using AVHRR Data RoyaNazari, Dr. MarouaneTemimi, Dr. Naira Chaouch and Dr. Reza Khanbilvardi, NOAA-CREST • The influences of lake ice on the environment • Ice identification methods
Aerosol Impact on Cloud Water Path • Ousmane Sy Savane, Brian Vant- Hull, Shayesteh Mahani, Reza Khanbilvardi • CE Dept at City College of New York 140 St at Convent Avenue, Steinman Hall e-mail: Osy_Savane@gc.cuny.edu • NOAA Collaborators: Robert Rabin (NSSL) Objectives: Assess the response of Cloud Liquid Water Path(CWP) in term in term of Aerosol(AOD) loading for 2 pairs of meteorological conditions: 1) Full dataset vs. Rain free dataset 2) High Water Vapor Ranges vs. Low or Moderate Water Vapor Ranges Cloud Water Path Response to Aerosol Cloud Liquid Water Response to Aerosol loading is the result of two conflicting processes (Droplet moistening which allow it to grow and its evaporation which tends to destroy it) Their respective strength may be dictate by the prevailing meteorological conditions
A neural network approach to retrieve the IOPs of the OCEAN from the MODIS sensor I. Ioannou, A. Gilerson, B. Gross, F. Moshary, S. Ahmed Optical Remote Sensing Laboratory The City College of the City University of New York Objective We design a Neural Network to retrieve the total absorption and backscattering at 442nm from the above water Reflectance as measured from the MODIS sensor Simulated dataset Field dataset Lee et. al. 2002
Enhanced Bio-Optical Algorithm and Statistical Classifier for Detections of Harmful Algal Blooms: Evaluating the Retrieval Accuracies SoeHlaing Tracing of Harmful Algae Bloom Animation of the Blooms of 13 Nov – 06 Dec 2004 detected by RBD technique Blooms of 18 Nov – 02 Dec 2004 identified by in-situ measurements 18 Nov 2004 22 Nov 2004 22 Nov 2004 02 Dec 2004 Source: http://tidesandcurrents.noaa.gov/hab/bulletins.html
Polarization Measurements and Analysis of Case I & II Water A. Ibrahim,A.Tonizzo, A. Gilerson, B. Gross, F. Moshary, and S. Ahmed Optical Remote Sensing Laboratory, the City College of the City University of NY, New York, NY, 10031, United States Case I water Case II water Comparison between MC simulations and measurements of DOP • A new hyperspectral multiangular polarimeter was developed to accurately measure the underwater polarized light field. • Polarization characteristics of under and above water light contain useful additional information on inherent optical properties (IOP), which can be accurately measured using Seaborne or Spaceborne instruments that can greatly contribute to the Research of Ocean Color community. • The results were confirmed by the Monte Carlo simulations.
Estimation of Surface Snowpack Properties using Multi-Frequency Microwave Remote Sensing Data Jonathan Muñoz1, Tarendra Lakhankar1, Peter Romanov 2 and Reza Khanbilvardi1 1 NOAA-CREST, City College of New York, 2 NOAA/NESDIS Silver Spring, MD Snow Depth HUT(Emissivity Model) Snow Grain Size Snow-PackProperties Emissivity In Situ Data Snow Density Temperature NOAA CRESTMulti-FrequencyRadiometer Analysis Validation & Improvement BrightnessTemperature Snow Depth Snow-PackProperties CRTM (Snow Module) Emissivity Temperature Radiometer Site Caribou, ME • Validation of satellite microwave remote sensing data using the NOAA-CREST Multi Frequency Microwave Radiometer for Snowpack properties. • Temporal analysis of in-situ snow-covered microwave brightness temperature to improve previously developed algorithm for snow cover and snow emission models for early and mid-winter, spring (melt-freeze period) and melting period. • Sensitivity Analysis of HUT snow model (Helsinki University of Technology) and CRTM (Community Radiative Transfer Model) Snow module for snow pack parameters.
Validation of NOAA IMS product with NCDC and EC Ground-based Data Christine Chen1, Tarendra Lakhankar1, Peter Romanov2, and Reza Khanbilvardi1 1 NOAA-CREST, The City College of New York, 2 NOAA/NESDIS/ORA Silver Spring, Maryland • Validation of NOAA’s interactive multisensory snow and ice mapping system (IMS) product using National Climatic Data Center (NCDC) and Environment Canada (EC) snow depth. • Statistical analysis of validation process using: • Snow classification (e.g. ephemeral, prairie, warm taiga) data, • Land classification (e.g. forest, mountain, flat plains) data, and • Snow depth (e.g. 1 inch, 2 inches, 3 inches).
Calibration and Validation of CASA Radar Rainfall Estimation Sionel A. Arocho-Meaux, UPRM NOAA-CREST Ariel Mercado-Vargas, Gianni A. Pablos-Vega, Eric W. Harmsen, Sandra Cruz-Pol, and José Colom-Ustáriz • Reliable and consistent weather data is needed in order to evaluate potential climate change and be able to take informed decisions in order to lessen the negative effects of natural disasters. Events like flash floods can be predicted by using models, however these require current and consistent rainfall information. • The Collaborative Adaptive Sensing of the Atmosphere (CASA) program at the University of Puerto Rico-Mayaguez is currently working with compact and low cost radars in order to estimate rainfall in western Puerto Rico. • These radars provide very high-resolution rainfall information; however, this method requires validation and calibration in order to be useful for monitoring weather events. For this purpose, a 28 rain gauge network in a 16-km2 area near the radar location was used as ground truth measurements. Various rain events were compared to the radar rainfall estimates and a mean bias correction factor of 0.8 was developed for total storm rainfall.
Comparisons are made between observed sea surface temperature and various models over . A 3- km horizontal resolution model performs as well or better than 1-km models. For the 1-km models, models with tidal forcing are qualitative improvements over the winds-alone model. Lagrangian particle tracking analysis is done to study the potential effect of near-surface internal tides on cross-shore transport. Geometry of the Sea Surface Temperature Front off the Oregon Coast 44.5 18 July Latitude [oN] 44 128 124 Longitude [oW] 128 124 Longitude [oW] 128 124 Longitude [oW] 128 124 Longitude [oW] 43.5 125 124.5 124 Longitude [oW] August GOES 1 km Winds-Only 1 km Winds + 8 Tidal Cons. 1 km Winds + M2 Tide 3 km Winds-Only 128 124 Longitude [oW] 47 45 43 41 Latitude [oN]
A History of RAMMB-NOAA at CSU: Cooperating in Atmospheric Science Don Hillger, NOAA/NESDIS/STAR/RAMMB (with contributions from the remainder of the RAMMB) Oct 2009 Mar 1987 Then Now Roger, Jim, John, Deb, Bob, Ray John, Dan, Mark, Don, Deb • The Regional and Mesoscale Meteorology Branch (RAMMB) has been at Colorado State University since 1980, at the inception of CIRA* • All 5 original RAMMB feds are retired, replaced one-by-one by a new set of 5 feds • A timeline with RAMMB history and events is provided *RAMMB works closely with many others at CIRA, to accomplish their research.