Download
1 / 16

E N D
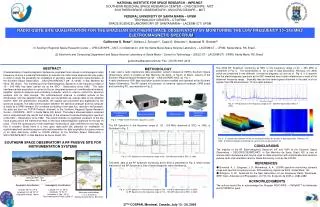
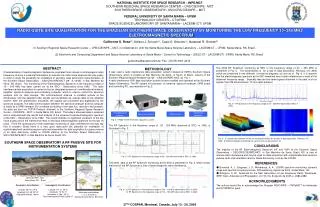
Investigation of electromagnetic ULF/ELF-phenomena possibly related to seismic events in south Europe during 2004 and 2005 using South European Ground Magnetometer (SEGMA) and DEMETER data.(1) G. Prattes/ (2) K. Schwingenschuh/ (3) W. Magnes/ (4) M. Stachel/ (5) M. Boudjada/ (6) M. Horn/ (7) M. Vellante.(2,3,4,5) Space Research Institute, Austrian Academy of Sciences, Schmiedlstrasse 6, A-8042 Graz, Austria(1) Department of Communication and Wave Propagation, technical University Graz, Austria.(6) Institute of Physics, Department of Geophysics, Astrophysics and Meteorology (IGAM), Karl-Franzens-University Graz, Austria.(7) Department of Physics, University of l’Aquila (Italy). Space Research Institute, Graz, Austria Workshop on ‘Earthquakes: Ground-based and Space Observations‘ 1-2 June 2007
Introduction Seismic events can possibly produce electromagnetic waves in the ULF/ELF frequency range. Two seismic events were investigated: 1. magnitude 5.5, depth=15km, date=july 10 2005, region of Podgorica Montenegro. 2. magnitude=5.4, depth=5.1km, date=july 12 2004, region of Bovec Slowenia. In the frame of the DEMETER and the SEGMA projects these phenomena are jointly investigated by ground based and space observations. ULF/ELF magnetic field data in mid and south Europe are provided by the South European Ground Magnetometer (SEGMA) chain. The sampling rate of the data analysed is between 1 and 16 Hz. The main problem occurring during analysing the data is to separate magnetic field disturbances which are caused by seismic events and geomagnetic activity or man made noise. One important parameter for the present analysis is the ratio of the vertical to the horizontal component (polarization) of the magnetic field. In order to differentiate man made noise from seismomagnetic events a quality figure of the stations has been determined. The global geomagnetic variations have been sorted out by using geomagnetic indices. ULF/ELF magnetic field data in Nagycenk (Hungary), L’Aquila (Italy) and Ranchio (Italy) have been correlated with the seismic events. Comparisons between results at 1Hz sampling frequency and 16Hz sampling frequency were made.
SEGMA stations Magnetic field data is measured at the following locations signed with yellow markers in the map. Data from the stations in Ranchio(RNC), Nagycenk(NCK), Castello Tesino(CST) and L’Aquila(LAQ) were analysed.
Event locations 2004 Information about the seismic event was supplied by DEMETER and ZAMG. It is designed to investigate disturbances in the Earth's ionosphere due to seismic and volcanic activities. Earthquakes in Austria and global heavy earthquakes are registered by ZAMG. The seismic event is depicted with the red marker. ZAMG registered the following seismic events in Austria from June to August 2004.
Event locations 2005 ZAMG registered the following seismic events in Austria from June to July 2005. *Intensity scale: “Europäische Makroseismische Skala, 1998 (EMS 98)”
Measuring system The CHIMAG fluxgate magnetometer Measurement range: +/- 512nT Maximum compensation field: +60000nT in X and Z +/- 30000nT in Y direction Accuracy: 8pT Sampling frequency: 64Hz (highest possible) Frequency resolution: 1Hz. The components of the measured Earth’s magnetic field are X,Y and Z. The X component is along the geographic meridian (positive northward), the Y component is along the geographic latitude (positive eastward) and the Z component is vertical and positive towards the Earth’s centre. The horizontal component of the magnetic field was calculated as
Seismic waves • Types of stress: • tensional • compressional • shear stress. • Produced elastic waves: • body waves • surface waves • Concerning body waves we distinguish p-waves and s-waves. • At p-waves or longitudinal waves the particle movement is along the direction of propagation. The elastic body wave passes through the medium as series of dilatations and compressions. At s-waves or transversal waves the particle movement is across the direction of propagation. The different wave forms are explained in the figure above. VP ~ 5 – 7 km/s in typical Earth’s crust. Velocity of elastic waves
Electromagnetic waves There are two possible ways to explain the emission of ULF perturbations. 1. ULF emission due to the mechanism of microfracture electrification. This effect appears as fast fluctuations of charge and electromagnetic field from an ensemble of opening microfractures, so called cracks (Molchanov and Hayakawa 1996). Dimension: 10-4m-10-1m Time scale: 10-4s - 10-7s. The velocity of the opening cracks is in the range of the seismic velocity of p- and s- waves~103m/s. If the rate of microcracks is rather high, the process will lead to origination of wideband electromagnetic noise. This noise might dissipate outside the source region and might produce noise like ULF emissions on the ground surface. • The same assumption of microfracturing, but the electromagnetic perturbation is caused by a magneto-hydro-dynamic (MHD) or inductive effect from a propagating seismic wave. • An inductive seismo-magnetic effect from a solitary seismic wave was assumed in relation to the observation of so called magnetic forerunners or coseismic electric signals were observed as well (Molchanov, Surkov, Hayakawa, Kulchitsky (2001)).
z + + + + - - - - x y Electromagnetic waves The figure shows the microcurrents ic(t) during a crack opening. The crack has got an elliptical cross section in the x - z plane and circular cross section in the z - y plane. The point x0 is a centre of an ellipsoidal crack. The circular lines show the conductive currents which destroy the charge fluctuation Q0 within the opening crack. The equivalent linear current is shown below by the solid arrow. It is supposed that some charge production Q0 exists inside the crack and on its boundary. A well known charge production is the piezoelectric effect. The charge Sc(t) … lateral surface of crack q0 …surface density of charge on the crack boundary.
Why ULF According to K. Simonyi the attenuation coefficient alpha for low frequencies is given as where σ the conductivity and μ is the magnetic constant. The skin depth
Data processing methods To estimate the wave intensity monthly mean and standard deviation were calculated. Comparison between the ULF wave activity and ΣKp helps to distinguish between space geomagnetic pulsations and emissions of pulsations which are not emitted in space. To decide whether the emission of pulsations is under the ground or not, the ratio of Z/H, so called polarization ratio is of essential importance. Data on day are much more variable than at night, as described in many publications, e.g. Hayakawa. So the night time period from L.T. 22.00h – 02.00h was chosen for detailed analysis. The wave forms of the field components in the H and Z direction during each 30 minutes interval are subjected to a FFT analysis. The data for one day consist of 8 such 30 minutes intervals. Further the power spectral density was calculated. The upper analyzable frequency is about 0.45Hz. The bandwidth from zero to 0.45Hz was divided into three parts from 10mHz – 50mHz, 50mHz – 100mHz and from 100mHz – 450mHz.
Geomagnetic activity Geomagnetic activity is expressed by the ΣKp. High ULF activity during the intervals with high ΣKp values is clearly associated with geomagnetic activity. Possible ULF waves in the frequency range of Pi2 and Pc4 waves appear around midnight of days with high geomagnetic activity. These pulsations are usually H-polarized causing a small polarization ratio on geomagnetic disturbed days. Disturbed day: Station: NCK date: 5.4.2005(22.00–02.00) H- component Kp = 36o, (D1) Quiet day: Station: NCK date: 10.4.2005 (22.00-02.00) H-component Kp = 4o,(Q1)
Observations 2004 The general situation is depicted for the stations in Castello Tesino, Nagycenk and Ranchio below. The bar plot shows the polarization in the low frequency band (10mHz-50mHz) after one day averaging from the 1st of June to the 31st of August 2004. The vertical full lines show the seismic events.
Observations 2004 The three bar plots compare the polarization of a geomagnetic quiet day (10.4.2005) with a disturbed day (5.4.2005) measured in Nagycenk and one day 19 days before an earthquake (23.6.2004) measured in Castello Tesino. The polarization on the quiet day is higher than on the disturbed day. The highest ratios are on the 23rd of June 2004 which was the day before the event. The time period from the 22nd to the 27th of June was geomagnetical quiet. Polarization mean values: Quiet day 0.3126 Disturbed day 0.0755 Day before the event 1.094 If the source of emission is under the ground the ratio is expected to be higher, even greater than 1 during concerned half hour intervals.
Observations 2004 The Z magnetic field component was analysed before the event happened at 13:04 on 12th of July 2004 using the IMF- toolbox. The magnetic field data from the stations in CST, NCK and RNC were Pc4 filtered and compared on the left. CST_maximum 3.7267nT CST_minimum -3.3021nT NCK_maximum 0.1655nT NCK_minimum -0.1950nT RNC_maximum 0.5071nT RNC_minimum -0.5072nT The upper panel on the right side shows the Z component of the magnetic field, in the lower panel the standard deviation calculated at 16Hz sampling frequency is depicted for the three stations.
Future outlook/References The correlation between the so far achieved results and the earthquake is slightly positive. The aim in future is to find more reliable mathematical methodologies to find out whether the emission of ULF perturbations is related to seismic activity or not. In this context the generation mechanisms of ULF seismogenic electromagnetic waves will be further investigated. Referring to wave propagation, skin depths and attenuation of electromagnetic waves in the lithosphere contacts to magnetotelluric working groups and geophysical departments are planned. References Hayakawa M., Ryusuke K., Molchanov O. and Kiyohumi Y.: Results of ultra-low-frequency magnetic field measurements during the Guam earthquake of 8 August 1993. Geophysical Research letters, Vol. 23, No.3, pages 241-244,February 1,1996. Molchanov O., Hayakawa M.: On the generation mechanism of ULF seismogenic electromagnetic emission. Physics Of The Earth and Planetary Interiors 105(1998)201-210. Molchanov O., Kulchitsky A., Hayakawa M.:Inductive seismo-electromagnetic effect in relation to seismogenic ULF emission. Natural Hazards and Earth System Science(2001)1:61-67. Kushwah V.K., Singh B.: Initial results of ultra low frequency magnetic field observations at Agra and their relation with seismic activities Current Science Vol. 87, No.3,10 August 2004. Kotsarenko A., Perez Enriquez R., Lopez Cruz-Abeyro J.A., Koshevaya S., Grimalsky V., Zuniga F.R.: Analysis of the ULF electromagnetic emission related to seismic activity, Teoloyucan geomagnetic station, 1998-2001. Natural Hazards and Earth System Science(2004)4:679-684.