Download
1 / 56
770 likes | 1.44k Views
Power Amplifier. SRSLab Hwang, in-hong Clickhih@hanmail.net. I N D E X. Introduction DC Simulation - IV Curve ( I DS vs V DS , V GS ) Conventional Schematic S-Parameter - Input , Output , Real matching Harmonic Balance - 2Tone_test (IM3) LSSP

E N D
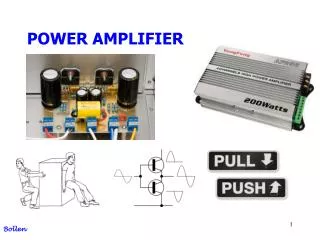
Power Amplifier SRSLab Hwang, in-hong Clickhih@hanmail.net
I N D E X • Introduction • DC Simulation - IV Curve ( IDS vs VDS , VGS ) • Conventional Schematic • S-Parameter - Input , Output , Real matching • Harmonic Balance - 2Tone_test (IM3) • LSSP - η(Efficiency) , PAE ( Power-added Efficiency ) - Gain , P1dB ,Gain flatness
Amplifier vi vo power stage driver stage • Input signal vi(t)= vcosω1t + vcosω2t • Output signal vo(t)= a1vi(t) +a2vi2(t) + a3vi3(t) +a4vi4(t) + a5vi5(t)+… • fundamental, IM3 frequency • vfund = { a1v + 9/4a3v3 + 25/4a5v5 } cos(ω1,2t) • vIM3 = { 3/4a3v3 + 25/8a5v5 } cos(2ω1,2 - ω2,1)
Input Network Output Network Z1 Z2 Zo Output Network Input Network Z1 Z2 Zo Matching methods • P79, 123 • Maximum Gain Input Network Output Network Z2 Z1 Zo • Maximum Power(Power Amplifier) • Minimum noise(LNA)
Amplifier Freescale (MRF21045)
Device (MRF 21045R3) • Goal • Class AB • Freq = 2.14 GHz • Gain = 10.2 dB • IMD3 = - 35dBc • Pout(Avg) = 10W (40dBm) • PAE = 26% • η = 28.5%
Substrate information T H Er Er (유전율) = 3.52 H (기판높이) = 0.762mm T (동판두께)= 0.035mm
Bias point Class (A, B, AB)
Class A AC 성분 차단 DC 성분 차단 RL ※ i0(t)=Imaxsinωt v0(t)=Vmaxsinωt ic(t)=iDC - Imaxsinωt vc(t)=VCC + Vmaxsinωt
Class A ID ID Imax Imax VDS VGS Bias Point Input Signal Output Signal ID waveform
Class A Conduction Angle (2π=360o) Vout
Class A • 장점 • 선형 동작 • 출력 신호 왜곡이 낮다 • 단점 • 낮은 효율 • 소자의 수명 단축 • 많은 전류가 요구 • 냉각을 위한 방열 시스템 필요 • 응용 • 높은 주파수, 광대역 동작이 필요 • 높은 선형성, 높은 이득, 낮은 출력
Class B vc1(t)= VCC + n1/n2 (Vmaxsinωt) = VCC + n21/n22 (Imax RL sinωt ) ※ i0(t)= n1/n2 (Imax sinωt ) v0(t)= i0(t)RL= n1/n2 (Imax RL sinωt ) =Vmax sinωt vc .max(t)= n1/n2 (Vmax) = n21/n22 (Imax RL)
Class B ID ID Imax Imax VGS VDS Bias Point Input Signal Clapping Signal Output Signal ID waveform
Class B Conduction Angle (π=180o) Vout
Class B • 장점 • 높은 효율 • 단점 • 낮은 선형성 • 냉각을 위한 방열 시스템 필요 • 응용 • 높은 효율
Class AB ID ID Imax Imax VDS VGS Bias Point Input Signal Clapping Signal Output Signal ID waveform
Class AB Conduction Angle (π~2π =180o ~ 360o) Vout
Conjugate Matching (Max. Gain)
Bias – point (Class AB) Fixed drain voltage
IDS vs VGS Class B (Ids=0) Class C
V_DC MOT_LDMOS INCLUDE SRC1 Vdc=3.82 V MOT_TECH_INCLUDE V_DC MTI DC_Feed SRC2 DC_Feed1 DC_Feed Vdc=27 V S-PARAMETERS DC_Feed2 S_Param SP1 Start=1.0 GHz Stop=2.5 GHz Step=20 MHz DC_Block DC_Block2 Term Term Term1 DC_Block Term2 Num=1 DC_Block1 Num=2 MRF_ROOT_MODEL Z=50 Ohm Z=50 Ohm MRF1 MODEL=MRF21045R3 Conventional Schematic RFC DC Block
Smith chart Flat table S11 =-8dB S22 = -1dB S21 = 6.83dB
50Ω Micro strip
Line calc.이용 기 판 정 보
RFC (VDS) Micro strip Z0 , β Zin ZL = 0 Zin = , jZotanβl at ZL =0 ∵ β = 2π / λ , l = λ/4 , tan90o = ∞
RFC (VGS) Micro strip Z0 , β Zin ZL = 0 Zin = , jZotanβl at ZL =0 ∵ β = 2π / λ , l = λ/4 , tan90o = ∞
Input – matching (S11) Bypass C Ideal components
Smith chart Flat table Max. Gain =13.56 dB
Power Matching (Max. Power)
Power Amp Design 2.14 GHz WCDMA Amplifier • Gain > 10 dB • 1-dB-compression > 45 dBm • Psat > 47 dBm Main challenge: designing for maximum power output During brainstorm process, decided: • two stages needed to get desired gain • stage one: • silicon transistor • passive bias • stage two: • power FET • active bias power stage driver stage
S 22 Designing the Output Stage for Maximum Output Power • output impedance varies as function of output power • ideal impedance exists for maximum output power • two technique provides information for output-stage matching • load-pull technique Low power High power
Pmax -1dB -2dB -3dB DUT Load-Pull Technique • vary magnitude and phase of load presented to circuit • power output is measured at each impedance point • can use behavioral model (based on measurements) Output impedance and power measurement system Input impedance and power measurement system X X X X Input Tuner Output Tuner Constant output power contours versus output load impedance (input power constant) Can be very expensive and time-intensive
Load-Pull Simulation - 6 dB contour - 5 dB contour - 4 dB contour - 3 dB contour - 2 dB contour Max. Power ( R + j X ) - 1 dB contour our designed impedance
P 2dB P1dB (1dB compression point) Saturated output power Output Power (dBm) Compression region Linear region (slope = small-signal gain) Input Power (dBm)
Stability Stability Circles
Gain(LSSP) Signal generator
Gain(LSSP) Gain = (Pout-Pin) = 10.2dB Pin = 30dBm , Pout = 40.2dBm
Gain flatness 허용오차 B/W = 80MHz 12 10 Gain (dB) 8 6 4 2100 2120 2140 2160 2180 2200 2220 Frequency ( MHz) 2100MHz ~ 2180MHz => Constant Gain