Download
1 / 21
210 likes | 354 Views
Numerical Simulations of Persistent Cold-Air Pools in the Uintah Basin, Utah . Erik M. Neemann , University of Utah Erik T. Crosman , University of Utah John D. Horel , University of Utah 94 th AMS Annual Meeting - 4 Feb 2014. 1. Overview. Uintah Basin Characteristics

E N D
Numerical Simulations of Persistent Cold-Air Pools in the Uintah Basin, Utah Erik M. Neemann, University of Utah Erik T. Crosman, University of Utah John D. Horel, University of Utah 94th AMS Annual Meeting - 4 Feb 2014 1
Overview • Uintah Basin Characteristics • Model Setup & Modifications • Boundary Layer Characteristics • Flow Patterns in the Basin • Impact of Spatial Snow Cover Variations Uintah Basin
Uintah Basin • Large, deep bowl-like basin with mountains rising over 1000 m on all sides • Extensive oil & gas operations result in large pollutant emissions NOx VOCs Snow Cover MODIS 3-6-7 RGB Snow/Cloud Product FINAL REPORT. 2012 UINTAH BASIN WINTER OZONE & AIR QUALITY STUDY • Presence of snow cover aids formation of strong cold-air pools (CAPs) below upper-level ridging • Stagnant conditions trap pollutants near surface, building concentrations • High-albedo snow enhances photolysis, leading to high ozone concentrations Fog/Stratus Snow Cover Bare Ground Z 2 Feb 2013 q Pollution builds below inversion
Model Setup & Domains Outer Domain • WRF-ARW v3.5 • - NAM analyses for initial & lateral BC • - 41 vertical levels • - Time step = 45, 15, 5 seconds • - 1 Feb 0000 UTC to 7 Feb 0000 UTC 2013 Inner Domain WY Subdomain 1.33 km Uinta Mountains 4 km SLV Wasatch Range Tavaputs Plateau 12 km • Parameterizations: • - Microphysics: Thompson • - Radiation: RRTMG LW/SW • - Land Surface: NOAH • - Planetary Boundary Layer: MYJ • - Surface layer: Eta Similarity • - Cumulus: Kain-Fritsch (12 km domain) • - Landcover/Land use: NLCD 2006 (30 m) Desolation Canyon CO UT
Summary of WRF Modifications • Idealized snow cover in Uintah Basin and mountains • Snow albedo changes • Edited VEGPARM.TBL • Microphysics modifications (Thompson) in lowest ~500m: • Turned off cloud ice sedimentation • Turned off cloud ice autoconversion to snow • Results in ice-phase dominated low clouds/fog vs. liquid-phase dominated • Allows model to achieve high albedos measured in basin Sensitivity to Microphysics Low stratus, fog Before After Fog containing ice particles Cloud Ice Cloud Water Cloud Ice Cloud Water VIIRS Nighttime Microphysics - 0931 UTC 2 Feb 2013 VIIRS 11-3.9 Spectral Difference - 0931 UTC 2 Feb 2013
WRF Sensitivity to Modifications Roosevelt Potential Temperature profiles 2-m Temperature Bias Original Modified Original Modified Observed 4 Feb 2013 5 Feb 2013
Impact of Liquid Clouds vs. Ice Clouds Over the entire model run, liquid clouds produced an average of 7-20 W/m2 more longwave energy than ice clouds in the Uintah Basin
Uintah Basin Flow Patterns Average Zonal Wind - All Hours Average Potential Temperature profile at Ouray Greatest Stability Ouray • Inversion/greatest stability typically between 1700 - 2100 m MSL • Weak easterly flow exists within and below inversion layer • Core greater than 0.5 m/s • Likely important role in pollutant transport within the basin
Uintah Basin Flow Patterns Nighttime Hours 1700L - 0700L Daytime Hours 0800L - 1600L Inversion Stable down to Surface upslope downslope Weak “mixed” layer • Easterly flow stronger during the day, weaker during the night • Indicates thermal gradients likely the main driver • Core winds greater than 1 m/s during the day • Diurnal upslope/downslope flows also apparent in day/night plots
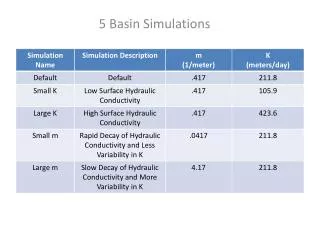
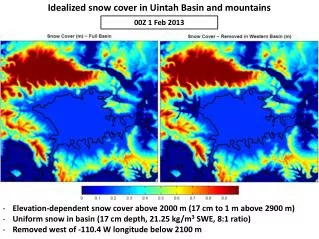
Idealized Snow Cover in Uintah Basin and mountains • Uniform snow on basin floor • 17 cm depth, 21.25 kg/m3 SWE, 8:1 ratio • Elevation-dependent snow cover above 2000 m • 17 cm to 1 m above 2900 m • Constructed to reflect observations inside basin and SNOTEL data in mountains 00Z 1 Feb 2013: Simulation start time
Sensitivity to Snow Cover Experiments 2-m Temperature: Difference from Full Snow case Potential Temperature Profile No Snow No Western Snow UPDATE No Snow No Western Snow Full Snow Observed 4 Feb 2013
Mean Afternoon Ozone Concentration 1 - 6 Feb 2013 1800 - 0000 UTC CMAQ output provided by Lance Avey at UTDAQ No Snow Snow • 4km WRF output run through Utah DAQ’s air quality model (CMAQ) • Modified WRF produced ozone concentrations up to 129 pbbv • Average decrease of ~ 25 ppbvwhen snow removed from basin floor • Highest concentrations confined to lowest 200-300 m in stable PBL/inversion, as observed during UBOS 2013 • No Snow run contains much lower ozone and deeper PBL
WRF v3.5 Setup • See Alcott and Steenburgh 2013 for further details on most aspects of this numerical configuration: • http://journals.ametsoc.org/doi/abs/10.1175/MWR-D-12-00328.1 • Overview summary of WRF Namelistoptions: • map_proj= 1: Lambert Conformal • NAM analyses provide initial cold start, land-surface conditions, & lateral boundary conditions • Idealized snow cover as function of height input to replace poor NOHRSC snow • 3 Domains with 12, 4, 1.33 km horizontal resolution (see next slide) • Number of vertical levels = 41 • Time step = 45 seconds (15, 5 s for inner 2 grids) • Microphysics: Thompson scheme • Radiation: RRTMG longwave, RRTMG shortwave • Surface layer: Monin-Obukov • Land Surface: NOAH • Planetary Boundary Layer: MYJ • Kain-Fritsch cumulus scheme in outer coarse 12 km grid • Slope effects for radiation, topographic shading turned on • 2nd order diffusion on coordinate surfaces • Horizontal Smagorinsky first-order closure for eddy coefficient • Landcover/Land use: National Land Cover Database (NLCD) 2006 1 arc-second (30 m) • Terrain Data: U.S. Geological Survey 3 arc-second (90 m)
Primary Outcomes from Microphysics Testing Model runs with “thick liquid clouds” Model runs with “thick ice clouds” Additional 2-3 deg C warm bias overnight Model runs with “clear sky”
Snow Albedo changes 0.52 - 0.57 Average 0.8 - 0.82 Average • Combination of VEGPARM.TBL and snow albedo edits achieve desired albedos • Set snow albedo to 0.82 within the basin (below 2000 m) • Left snow albedo as default value outside the basin • Change in land use dataset accounts for differences outside the basin 19
Idealized Snow Cover in Uintah Basin and mountains 00Z 1 Feb 2013 • NAM overestimation inside Uintah Basin (22 to 28 cm) • Elevation-dependent snow cover above 2000 m (17 cm to 1 m above 2900 m) • Uniform snow in basin (17 cm depth, 21.25 kg/m3 SWE, 8:1 ratio)