1 / 2

The population of Texas from 1900 to 1980 is displayed in the figures below

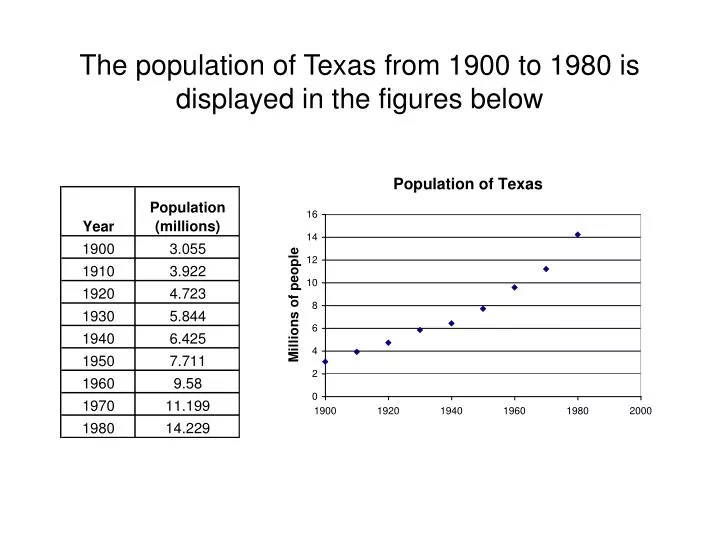
The population of Texas from 1900 to 1980 is displayed in the figures below. An exponential model of the population can be constructed from any two points. Not surprisingly, using data points that are further out in time appears to give a better fit.

kato
Download Presentation

The population of Texas from 1900 to 1980 is displayed in the figures below

An Image/Link below is provided (as is) to download presentation Download Policy: Content on the Website is provided to you AS IS for your information and personal use and may not be sold / licensed / shared on other websites without getting consent from its author. Content is provided to you AS IS for your information and personal use only. Download presentation by click this link. While downloading, if for some reason you are not able to download a presentation, the publisher may have deleted the file from their server. During download, if you can't get a presentation, the file might be deleted by the publisher.

E N D

Presentation Transcript


  1. The population of Texas from 1900 to 1980 is displayed in the figures below

  2. An exponential model of the population can be constructed from any two points Not surprisingly, using data points that are further out in time appears to give a better fit.

More Related