Download
1 / 34
340 likes | 427 Views
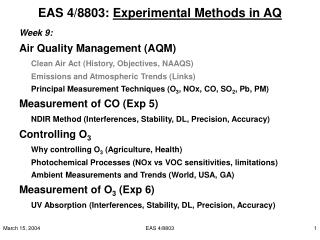
EAS 4/8803: Experimental Methods in AQ. Weeks 8 - 11: Air Quality Management (AQM) Clean Air Act (History, Objectives, NAAQS) Emissions and Atmospheric Trends (Links) Principal Measurement Techniques (O 3 , NOx, CO, SO 2 , Pb, PM) Measurement of CO (Exp 5)

E N D
EAS 4/8803: Experimental Methods in AQ Weeks 8 - 11: Air Quality Management (AQM) Clean Air Act (History, Objectives, NAAQS) Emissions and Atmospheric Trends (Links) Principal Measurement Techniques (O3, NOx, CO, SO2, Pb, PM) Measurement of CO (Exp 5) NDIR Method (Interferences, Stability, DL, Precision, Accuracy) Controlling O3 Why controlling O3 (Agriculture, Health) Photochemical Processes (NOx vs VOC sensitivities, limitations) Ambient Measurements and Trends (World, USA, GA) Measurement of O3 (Exp 6) UV Absorption (Interferences, Stability, DL, Precision, Accuracy) EAS 4/8803
Comparison of 1970 and 2002 Emissions EPA 454/K-03-001, Latest Findings on National Air Quality, August 2003, www.epa.gov/airtrends EAS 4/8803
Link: Emissions Air Quality • CAUTION!! • Most emissions are estimated NOT measured (uncertainty). • Most monitors located in urban environments (representation). • Some APs are formed in atmosphere via secondary reactions (PM, O3). • Secondary reactions have different sensitivities (to precursors) and yields: P(O3), P(SOA). • Meteorology plays underlying role (BL dynamics, radiation, rainfall). EPA 454/K-03-001, Latest Findings on National Air Quality, August 2003, www.epa.gov/airtrends EAS 4/8803
Success: Emissions Reductions Despite Growth CO, NOx, VOC, SO2, PM, Pb EPA 454/K-03-001, Latest Findings on National Air Quality, August 2003, www.epa.gov/airtrends EAS 4/8803
Emissions/AQ Trends: SO2 Emissions Sources (2001) AQ • Potential Risks andEffects • Breathing impairment • Respiratory, cardiovascular {PM} • Precursor for PM • Acidification (soils, waters) • Corrosion (bldgs, monuments) • Visibility EAS 4/8803
SO2SO4= in Greater Atlanta for July 2001 EAS 4/8803
Emissions/AQ Trends: NOx (NO+NO2) Sources (2001) Emissions • Potential Risks andEffects • Airway, lung function • Respiratory illness, infection • Precursor for O3 and PM • Acid deposition (nutrient loss) • Eutrophication (algae bloom) • Visibility AQ EAS 4/8803
Emissions/AQ Trends: CO Sources (2001) Emissions • Potential Risks andEffects • Blood-O2 deficiency • Cardiovascular (angina pectoris) • Visual, neurological impairment • Role in P(O3) via HOx cycle (slow) AQ EAS 4/8803
13-County Metro Atlanta: 120 Mio VMT daily Strategies for Metropolitan Atlanta's Regional Transportation and Air Quality (SMARTRAQ) Source: EPA Office of Transportation and Air Quality, "Average Annual Emissions and Fuel Consumption for Passenger Cars and Light Trucks“, see http://www.epa.gov/otaq/consumer/f00013.htm EAS 4/8803
Atlanta August 1999: Average Diurnal Profile EAS 4/8803
downwind Griffin Air mass arriving at Griffin has significantly higher CO/NOy ratio in summer than in winter: Loss of more abundant summertime HNO3 due to surface deposition! Source – Receptor Considerations: CO/NOy Atlanta JST Higher intercept points to elevated regional background CO! Long-range transport of wild fires’ plumes (see SOS’95)? Or other high-CO/low-NOx sources? EAS 4/8803
Regional CO vs Burn Activity in GA Monthly average CO background level derived from CO/NOy regressions at OLC (left) in comparison with prescribed burn areas at Forts Benning and Gordon, their surrounding counties, and the rest of Georgia (only 10% of true area plotted!). EAS 4/8803
Emissions/AQ Trends: VOC Sources (2001) excl BHC Emissions • Potential Risks and Effects • Multitude of species • Some toxic (aromatics, FCHCs) • Some vital precursors for O3 AQ in Pensacola EAS 4/8803
VOC Emissions from Prescribed Burning Mixing ratios enhanced above local background at Fort Gordon TA21. Fuel: 230 acres of 2 year rough of pine needles, leaves, and woody debris. EAS 4/8803
PB Emission Rate Estimates for Aromatics (C>6)Comparison with Mobile Sources Average emissions per burn (~500 acres) compare with daily mobile emissions ! 3-, and 4-Ethyltoluene higher during smoldering, 2-Ethyltoluene, Isopropyl-, and Ethyl-benzene highest for gasoline fueled vehicles. EAS 4/8803
Emissions/AQ Trends:Primary PM10 Sources (2001) Emissions • Potential Risks andEffects • Heart (arrhythmias, attacks) • Respiratory (asthma, bronchitis) • Among elderly and young • Vegetation (ecosystem) • Buildings, Materials • Visibility AQ EAS 4/8803
Emissions/AQ Trends:Primary PM2.5 Sources (2001) Emissions AQ • Potential Risks andEffects • Heart (arrhythmias, attacks) • Respiratory (asthma, bronchitis) • Among elderly and young • Vegetation (ecosystem) • Buildings, Materials • Visibility EAS 4/8803
15 14 Carbonyls Cyclic compounds 13 Branched Alkanes 12 n-Alkynes 11 Aromatics n-Alkanes 10 n-Alkenes 9 8 Mass Emission Rate (g/kg of biomass burned) 7 6 5 4 3 2 1 0 FPSP WGLP MHFF Pinus taeda Pinus ponderosa Tsuga heterophylla Direct (Primary) PM Emissions from Foliar Fuel Combustion in Lab Hays, Geron et al., ES&T 36, 2281-2295, 2002 Biomass Litter Composites MHFF… mixed hardwood (oak) forest foliage FPSP… Florida palmetto & slash pine WGLP… wiregrass & longleaf pine EAS 4/8803
POC PBS High-Vol Sampling and GC/MS Analyses Quantification of >100 Particle-phase Organic Compounds Retene Pimaric acid Abietic acid Sandaracopimaric acid Levoglucosan Five consecutive 5-h samples taken at OLC between February 5th 1200 and 6th 1300 EAS 4/8803
Nighttime avg 53% wood ? Influence from February 5th Burn: Source Apportionment Low P front moving through GA on 3rd and 4th, with cold dry air moving in behind it from NE, causing below normal T under clear skies. Prescribed burning of 937 acres on 2/5 1200 at ~28 km to east, smoldering until 2/6 am. EAS 4/8803
? O3, SOA CO CO2 VOCs NOx PM Toxics EAS 4/8803
Secondary organic aerosol (SOA): Organic compounds, some highly oxygenated, residing in the aerosol phase as a function of atmospheric reactions that occur in either gas or particle phases. SOA formation mainly depends on: Emissions & forming potential of precursors aromatics (BTX, aldehydes, carbonyls) terpenes (mono-, sesqui-) other biogenics (aldehydes, alcohols) Presence of other initiating reactants O3, OH, NO3, sunlight, acid catalysts Mechanisms (with half hr to few hr yields): Gas-to-particle conversion/partitioning e.g. terpene oxidation Heterogeneous reactions aldehydes via hydration and polymerization, forming hemiacetal/acetal in presence of alcohols Particle-phase reactions acetal formation catalytically accelerated by particle sulfuric acid (Jang and Kamens, ES&T, 2001) EAS 4/8803
January May 2003 Seasonal PM2.5 Mass, Composition & [O3-max] Relationships with Prescribed Burning Higher PM mass and OM/OC with higher [O3] later in the season No burn 935 acres 1256 3770 4006 504 251 EAS 4/8803
Potential P(SOA) Estimates for Aromatics (C>6) Emitted by Prescribed BurningComparison with Mobile Sources Contribution to P(SOA) potential is highest for Toluene from flaming and Xylenes from smoldering, minimal for 2-Ethyltoluene. EAS 4/8803
Other (Inorganic) Secondary PM Formation Secondary formation is a function of many factors including: concentrations of precursors, other gaseous reactive species (e.g., O3, OH), atmospheric conditions, and cloud or fog droplet interactions. Gas-to-particle conversion (oxidation) SO2(g) HOSO3 H2SO4 + 2NH3 (NH4)2SO4 NOx(g) HNO3 + NH3 NH4NO3 Heterogeneous reactions EAS 4/8803
PM2.5 Seasonal Comparison: Suburban vs Rural Suburban Hendersonville Rural Dixon Summer-99 Fall-99 Winter-99/00 • Differences in composition are insignificant regionally but not seasonally • Differences in mass related to different BL dynamics and SOA (Un-ID) EAS 4/8803
Comparison of Seasonal and Regional Averages: PM2.5 & O3 • Seasonal [PM2.5]-mass /-SO4= / [O3] correlation: high in summer, low in fall & winter • Houston TexAQS measurements governed by local emissions, episodes and meteorology • BL dynamics contributing to sub-regional differences between H.ville & Dixon • Unidentified [PM2.5] mass highest and most variable in summer (SOA) EAS 4/8803
Summertime PM2.5 – Max(O3) Relationship Tighter correlation in July 2001. “Downwind” Griffin site offset to higher PM2.5 mass. August 99 in Atlanta was hotter, dryer, more polluted with O3-precursor species. EAS 4/8803
Seasonal & Regional Comparison of PM2.5 Composition Summer Months Winter Months Regional Difference: Higher OM/OC and OC/EC at more rural site! Seasonal Difference: Lower OM/OC and (higher) OC/EC in winter. More SOA in August 99?More oxygenated POCs away from Atlanta? EAS 4/8803
PM2.5 Wind Roses: Seasonal Differences Across GAIndications for Regional Transport? Period 2001+ 02 MAY-OCT NOV-APR Aug’99 EAS 4/8803
…Similarity to Daytime O3 Period 2001+ 02 MAY-OCT NOV-APR Aug’99 EAS 4/8803
Emissions/AQ Trends: O3 Secondary Product !! old 1h NAAQS new 8h NAAQS • Potential Risks andEffects • Acute health (respiration, asthma) • Chronic health (obstructive pulmonary) • Vegetation damage (chlorophyll) • Agriculture (crop & forest yields) • Materials deterioration EAS 4/8803
Photochemical Processes Leading to O3 and PM An Assessment of Tropospheric Ozone Pollution, A North American Perspective, NARSTO, National Acad. Press, 2000. NOz SOA EAS 4/8803
Ground-level Ozone Formation Volatile Organic Compounds (VOCs) + Nitrogen Oxides (NOx) Ozone (O3) Smog Combustion Processes Fuels, Paints, Solvents, & Vegetation EAS 4/8803