Download
1 / 54
4.37k likes | 11.65k Views
Bhuj Earthquake India . Presented by - Abhishek R. Dangi M.Tech (DAM) MNIT, Jaipur. I. Gujarat : Disaster on a day of celebration. 51 st Republic Day on January 26, 2001. Earthquake: Gujarat, India. January 26, 2001. Gujarat 2001. 7.9 on the Richter scale.

E N D
Bhuj Earthquake India Presented by - Abhishek R. Dangi M.Tech (DAM) MNIT, Jaipur
I. Gujarat : Disaster on a day of celebration 51st Republic Day on January 26, 2001
Earthquake: Gujarat, India January 26, 2001
Gujarat 2001 7.9 on the Richter scale. 8.46 AM January 26th 20,800 dead
Basic Facts Earthquake: 8:46am on January 26, 2001 Epicenter: Near Bhuj in Gujarat, India Magnitude: 7.9 on the Richter Scale
Geologic Setting Indian Plate Sub ducting beneath Eurasian Plate Continental Drift Convergent Boundary
Specifics of 2001 Quake Compression Stress between region’s faults Depth: 16km Probable Fault: Kachchh Mainland Fault Type: Reverse Dip-Slip (Thrust Fault)
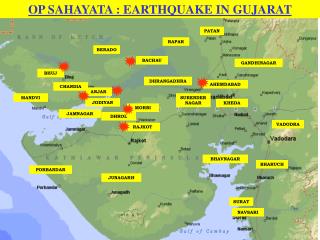
Location The earthquake’s epicentre was 20km from Bhuj. A city with a population of 140,000 in 2001. The city is in the region known as the Kutch region. The effects of the earthquake were also felt on the north side of the Pakistan border, in Pakistan 18 people were killed.
Tectonic systems The earthquake was caused at the convergent plate boundary between the Indian plate and the Eurasian plate boundary. These pushed together and caused the earthquake. However as Bhuj is in an intraplate zone, the earthquake was not expected, this is one of the reasons so many buildings were destroyed – because people did not build to earthquake resistant standards in an area earthquakes were not thought to occur. In addition the Gujarat earthquake is an excellent example of liquefaction, causing buildings to ‘sink’ into the ground which gains a consistency of a liquid due to the frequency of the earthquake. Bhuj
India : Vulnerability to earthquakes 56% of the total area of the Indian Republic is vulnerable to seismic activity. • 12% of the area comes under Zone V (A&N Islands, Bihar, Gujarat, Himachal Pradesh, J&K, N.E.States, Uttaranchal) • 18% area in Zone IV (Bihar, Delhi, Gujarat, Haryana, Himachal Pradesh, J&K, Lakshadweep, Maharashtra, Punjab, Sikkim, Uttaranchal, W. Bengal) • 26% area in Zone III (Andhra Pradesh, Bihar, Goa, Gujarat, Haryana, Kerala, Maharashtra, Orissa, Punjab, Rajasthan, Tamil Nadu, Uttaranchal, W. Bengal)
Gujarat: an advanced state on the west coast of India. • On 26 January 2001, an earthquake struck the Kutch district of Gujarat at 8.46 am. • Epicentre 20 km North East of Bhuj, the headquarter of Kutch. • The Indian Meteorological Department estimated the intensity of the earthquake at 6.9 Richter. According to the US Geological Survey, the intensity of the quake was 7.7 Richter. • The quake was the worst in India in the last 180 years.
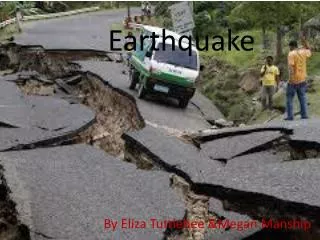
What earthquakes do • Casualties: loss of life and injury. • Loss of housing. • Damage to infrastructure. • Disruption of transport and communications. • Panic • Looting. • Breakdown of social order. • Loss of industrial output. • Loss of business. • Disruption of marketing systems.
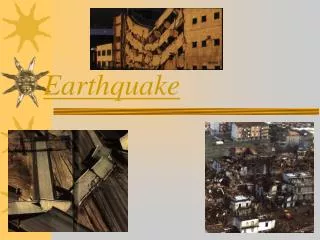
A summary • The earthquake devastated Kutch. Practically all buildings and structures of Kutch were brought down. • Ahmedabad, Rajkot, Jamnagar, Surendaranagar and Patan were heavily damaged. • Nearly 19,000 people died. Kutch alone reported more than 17,000 deaths. • 1.66 lakh people were injured. Most were handicapped for the rest of their lives. • The dead included 7,065 children (0-14 years) and 9,110 women. • There were 348 orphans and 826 widows.
Loss classification • Deaths and injuries: demographics and labour markets • Effects on assets and GDP • Effects on fiscal accounts • Financial markets
Disaster loss • Initial estimate Rs. 200 billion. • Came down to Rs. 144 billion. • No inventory of buildings • Non-engineered buildings • Land and buildings • Stocks and flows • Reconstruction costs (Rs. 106 billion) and loss estimates (Rs. 99 billion) are different • Public good considerations
Human Impact: Tertiary effects • Affected 15.9 million people out of 37.8 in the region (in areas such as Bhuj, Bhachau, Anjar, Ganhidham, Rapar) • High demand for food, water, and medical care for survivors • Humanitarian intervention by groups such as Oxfam: focused on Immediate response and then rehabilitation • Of survivors, many require persistent medical attention • Region continues to require assistance long after quake has subsided • International aid vital to recovery
Social Impacts • However at the same time, looting and violence occurred following the quake, and this affected many people too. • On the other hand, the earthquake resulted in millions of USD in aid, which has since allowed the Bhuj region to rebuild itself and then grow in a way it wouldn’t have done otherwise. • The final major social effect was that around 400,000 Indian homes were destroyed resulting in around 2 million people being made homeless immediately following the quake. • 80% of water and food sources were destroyed. • The obvious social impacts are that around 20,000 people were killed and near 200,000 were injured.
Social security and insurance • Ex gratia payment: death relief and monetary benefits to the injured • Major and minor injuries • Cash doles • Government insurance fund • Group insurance schemes • Claim ratio
Demographics and labour market • Geographic pattern of ground motion, spatial array of population and properties at risk, and their risk vulnerabilities. • Low population density was a saving grace. • Holiday • Extra fatalities among women • Effect on dependency ratio • Farming and textiles
Economic Impacts • Total damage estimated at around $7 billion. However $18 billion of aid was invested in the Bhuj area. • Over 15km of tarmac road networks were completely destroyed. • In the economic capital of the Gujarat region, Ahmedabad, 58 multi storey buildings were destroyed, these buildings contained many of the businesses which were generating the wealth of the region. • Many schools were destroyed and the literacy rate of the Gujarat region is now the lowest outside southern India.
Impact on GDP • Applying ICOR • Rs. 99 billion – deduct a third as loss of current value added. • Get GDP loss as Rs. 23 billion • Adjust for heterogeneous capital, excess capacity, loss Rs. 20 billion. • Reconstruction efforts. • Likely to have been Rs. 15 billion.
Fiscal accounts • Differentiate among different taxes: sales tax, stamp duties and registration fees, motor vehicle tax, electricity duty, entertainment tax, profession tax, state excise and other taxes. Shortfall of Rs. 9 billion of which about Rs. 6 billion unconnected with earthquake. • Earthquake related other flows. • Expenditure:Rs. 8 billion on relief. Rs. 87 billion on rehabilitation.
Impact on Revenue • Sales tax losses for February and March 2001 were Rs 115 crore. For 2001-02, the losses were expected to be Rs 260 crore. • Only 10% of the estimated stamp duty and registration fees were expected to be realised in February and March 2001, . For 2001-02, collections were expected to fall by 50%. • Motor vehicle tax collections were expected to fall short of budgeted figures by almost Rs 600 crore. • Monthly losses of Rs 4 crore each were projected for electricity duty and entertainment tax. • Professional taxes were expected to be lower by Rs 5 crore in the current year.
Impact on Revenue (contd.) • The impact on total tax revenues was estimated at Rs 286 crore, Rs 345 crore, and Rs 436 crore, in 2000-01, 2001-02, and 2002-03 respectively. • Total own taxes (as % of SDP) were expected to fall from budgeted estimate of 8.56% (2000-01) to 7.85% and further to 7.46% in 2001-02. • Total tax revenue (as% of SDP) was expected to decline from budgeted estimate of nearly 10% (2000-01) to 9.27% and further to 8.76% in 2001-02
Impact on Expenditure • Total relief expenditure (food supplies, medical relief, debris removal, and cash compensation) was estimated at around Rs 840 crore. • Total rehabilitation expenses were figured at Rs 8665 crore. Housing accounted for the highest expenditure (Rs 5148 crore), followed by education (Rs 837 crore) and drinking water (Rs 614 crore). • Total (relief and rehabilitation) expenses amounted to Rs 9,345 crore.
Other Economic Impacts • Non-tax revenues : Interest receipts, irrigation receipts, and royalties were expected to remain largely unaffected. • Municipal finances: Almost 10% of municipal revenues were expected to be lost in a year. • Banking : 68 commercial bank branches were fully damaged and 80 branches were partially damaged. • Financial market: The wealth loss was expected to lead to reshuffling of peoples’ portfolios and affect asset market behaviour. • Employment: Nearly 5 lakh people were expected to become unemployed. Employment in salt, ceramic, and small-scale industries (including refractories, powerlooms, cotton ginning etc.) was worst affected.
Financial arrangements • Calamity Relief Fund (CRF) in each state. • The CRF allocation during the period 2000-05 has been increased to Rs 11007.56 crore as compared with Rs 6304.27 crore during 1995-2000. • The efforts are supplemented by provision of additional assistance from National Calamity Contingency Fund (NCCF) during severe calamities.
Calamity Relief Fund (CRF) • Came into force from April 1990. • Set up by each state for financing natural calamity relief assistance (earthquake, cyclone, flood etc.). • Financial share of 3:1 between the Government of India and states. • The government of India’s share comes in as grant-in-aid. • A state-level committee headed by the Chief Secretary of the state administers the Fund.
National Calamity Contingency Fund (NCCF) • Came into force from 2000-01. • Aims to assist natural calamities (earthquake, flood, drought etc.) when the magnitude of the disasters require more support than what the state can provide. • The initial corpus of NCCF was Rs 500 crore. • The National Centre for Calamity Management (NCCM) under the M/o Home Affairs administers the Fund. • Assistance provided by the Centre to States from NCCF is financed by levy of special surcharge on Central taxes for a limited period.
Expenditure norms under NCCF and CRF • Ex-gratia payment to families of deceased persons: Rs 50,000/- per person. • Ex-gratia payment for loss of limbs/eyes: Rs 25,000/- per person. • Injury leading to hospitalisation for more than one week: Rs 5,000/ per person. • Relief for old, infirm and destitute children: Adults- Rs 20/- per day; children- Rs 10/- per day. • Repair/restoration of damaged houses: Fully damaged – Rs 10,000/- (Rs 6,000/- for kuccha); severely damaged – Rs 2,000/- (Rs. 1,000/- for kuccha) • Assistance to artisans (as subsidy) for repair/replacement of damaged equipment : Traditional craft – Rs 1,000/- per person; Handloom weavers – Rs 1,000/- per loom.
Gujarat : Assistance provided • Immediate relief of Rs 500 crore from the NCCF. • NCCF augmented by imposing a 2% surcharge on personal and corporate income tax in Union Budget (2001-02) for assisting Gujarat. • Rs 110 crore provided from PM’s Relief Fund. • Assistance was provided under various centrally sponsored schemes for reconstruction of social and physical infrastructure. • Arrangements were tied up with ADB and World Bank for credit worth US $800 million. • NHB and HUDCO set apart adequate funds for housing reconstruction. • RBI instructed banks to freeze recoveries and extend liberal loans. • Gujarat government was enabled to float tax-free earthquake bonds.
Environmental Impacts • 80% of water and food sources were destroyed. • Over a million structures were damaged, as a result local resources were used on a very high scale in order to repair and rebuild the region. • The area was once India's most visited region (by tourists) outside the central cities. However after many of the old, historic buildings were destroyed this element of the economy was destroyed. As a result the money no longer exists to maintain the environment to the same standard.
‘Dewatering’ This was the major cause of the percentage of crops which were destroyed. Groundwater was brought to the surface by the frequency of the quake…the groundwater then flowed away in the Indian ocean, as such even months and years later the water table in the region has a reduced quantity and crop yields are still less plentiful then pre-quake years. The purple spots represent this water.
Disaster loss, reconstruction cost and output loss • ADB and World Bank’s Gujarat Earthquake Assessment Mission visited Gujarat during February 11-22, 2001 for assessing the economic impact of the earthquake. • The disaster loss was estimated at Rs 99 billion. • Reconstruction costs were estimated at Rs 106 billion. • The annual loss of state domestic product was estimated at around Rs 20 billion (assuming an ICOR of 4) for the first 12 months.
Relief functions: Primary and Secondary Primary: • Operate warning systems. • Restore and maintain uninterrupted communication. • Maintain transportation for evacuation & movement of essential commodities. • Ensure availability of drugs & medicines. • Mobilise financial resources. Secondary : • Rehabilitation through military aid to civil authorities • Coordinating activities of state and voluntary agencies • Preparing contingency plans for crops, cattle preservation, nutrition and health measures. • Providing technical and technological inputs for drinking water.
Challenges Transportation System: • Airports closed • City in gridlock as traffic lights were out • Cars were used to transport injured due to run out of ambulances
Telecommunication System: • Telecommunication system was disrupted initially • People were requested to use messaging service instead of calling, so that emergency services can use the phone lines. • Telephone companies established emergency lines and free call facilities after few hours.
Response & Rescue opertion Search and rescue operations International Community – Response Response within the country First impressions of shelters Health initiatives
Search and rescue operations • All sizes and hues, relief equipment, personnel and rescue teams with their equipment. • Transportation trucks at times were not available and there was difficulty in finding labour for loading and unloading material which caused avoidable and critical delays.
International Community - Response • 17 Search and Rescue (SAR) teams made up of 399 rescuers and 26 rescue dogs equipped with technical and rescue equipment assisted in the search and rescue operation. • Teams from Switzerland, Scotland, Mexico, France, Spain, Poland, Turkey, Japan were most active in this task. • More than 300 persons were rescued alive in the first 5 days. • CARE Canada & Norway arrived in Bhuj with 2650 tents. • 40 persons relief team were engaged in relief work. • The medical teams with medicines arrived from France, Japan, South Korea, Mexico, and other countries. • 66 countries, 24 other international donors/various international organisations sent rescue teams including sniffer dogs, relief materials and mobile hospitals.
Response within the country • Several CSOs/NGOs/philanthropists and rescue teams rushed to Gujarat from all over the country. • Gujaratis and residents of different states set up community kitchens. One such was set up in Adesar by an organisation called ‘Jain Sasan’ of Mumbai in which more than 3500 persons were served food per day. • Air force was bringing airmen everyday for Ahmedabad in which a large number of ex-servicemen came forward to work for the rescue and relief . • Transportation facilities were extended for relief material abroad With free handling facilities to charter flights bringing in relief materials. • By 5th February 2001 – financial assistance of IRS 500.00 Crores equaling USD 1 billion by Central govt. was commited. • In addition, 95,000 MT of food, other materials like clothing and tents, medical supplies and personnel, fuel and communication equipment were made available.
Health initiatives • The army colonel whose unit was airlifted for emergency medical operations due to their experience of handling the cyclone in Orissa and earthquake in Latur stated that he hadn’t had a bath for 4 days. • He could predict a pattern in the inflow of patients in disasters who start trickling in after the first 24 hrs and the flow becoming a deluge after 48 hrs and tapering off after nearly 7 days. • Indian doctors worked as a team with foreign health teams. • Foreign mobile hospitals were operationalised within 24 hrs of their arrival.
Rescue Operations Involved Personas: • firefighters • paramedics • rescue specialists • emergency room physicians • structural engineers, • heavy equipment specialists, • hazardous materials technicians, • communications specialists • logistics specialists.
A Participatory Approach • Disaster management is primarily responsibility of State Governments. • The Government of India supplements state through policy and administrative response. • Policy response comprises of activating administrative machinery for assisting relief measures and monitoring progress. • Administrative response comprises of primary and secondary relief functions.
Reconstruction Activities • The reconstruction process involves a wide range of activities. For the • purpose of this paper, these activities have been grouped under the following titles. • The next sections analyze the mitigation aspect of each of these activities. • Key activities: • Mapping and property database • Preparation of a city-level development plan • The development of urban infrastructure • Town planning schemes to redevelop the walled city • Experiments in community planning, institution building and supporting civil society initiatives.
Disaster waste disposal • Recycling all debris after a disaster was costly and disruptive • Choosing 100 per cent recycling would be great for the environment, but cost more and take a lot longer.