Download

1 / 57
570 likes | 697 Views
High Energy Dilepton Experiments. Experiments @ RHIC. RHIC. RHIC = Relativistic Heavy Ion Collider located at Brookhaven National Laboratory. STAR. RHIC and its experiments. what’s so special about RHIC? it’s a collider no thick targets

E N D
High Energy Dilepton Experiments Experiments @ RHIC
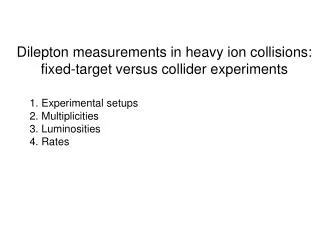
RHIC • RHIC = Relativistic Heavy Ion Collider • located at Brookhaven National Laboratory
STAR RHIC and its experiments • what’s so special about RHIC? • it’s a collider • no thick targets • detector systematics do not depend on ECM • p+p: √s ≤ 500 GeV (polarized beams) • A+A: √sNN ≤ 200 GeV (per NN pair) • experiments with specific focus • BRAHMS (until Run-6) • PHOBOS (until Run-5) • multi purpose experiments • PHENIX • STAR
SPS (Pb-Pb) RHIC (Au-Au) dN( p ) / dy produced baryons (p, p, n, n ) 6.2 24.8 20.1 80.4 p – p participants nucleons (p – p )A/Z 33.5 85 8.6 21.4 Total baryon density 110 102 Low mass e+e-: prospects @ RHIC • 2 scenarios @ SPS profit from high baryon density • dropping r mass • broadening of r • what to expect at RHIC? • baryon density: almost the same at SPS & RHIC (although the NET baryon density is not!)
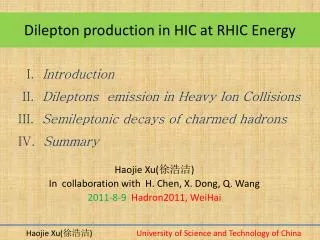
e+e-: theoretical guidance at RHIC R. Rapp: nucl-th/0204003 e- e+ • in-medium modifications of vector mesons persists • open charm contribution becomes significant
The founding fathers’ view • before 1991 • proposals for various experiments at RHIC • STAR, TALES, SPARC, OASIS, DIMUON … • except for STAR everything else is burned down • from the ashes rises PHENIX • Pioneering High Energy Nuclear Interaction eXperiment • 1991: PHENIX“conceptual design report” • philosophy • measure simultaneously as many observables relevant for QCD phase transitions as you can imagine • all but one: low-mass dielectrons • why no dielectrons? • included in first TALES proposal • considered to be “too difficult” for PHENIX • a lot of work can make impossible things happen
central spectrometers • measurement in range:|h| 0.35 p 0.2 GeV/c • forward spectrometers • muon measurement in range: 1.2 < |h| < 2.4 p 2 GeV/c two central electron/photon/hadron spectrometers two forward muon spectrometers PHENIX in principle • 3 detectors for global event characterization
p g e+ e- DC PC1 PC3 PHENIX: tracking & particle ID
Momentum determination • Simple relation between bending and momentuma = K/pT K~200 radGeV/c • Momentum resolution is determined by the resolution of a, which is determined by : • single hit resolution(SHR) and • alignment • SHR is measured to be 150mm, about 0.3 mrad, which corresponds to 0.3/200=0.1% resolution. • Affected by • global and wire alignments
Electron Identification I • Charged particle tracking (dm: 1%) DC, PC1, PC2, PC3andTEC • PHENIX optimized for Electron ID • Cherenkov light RICH+ • shower EMCAL • emission and measurement of Cherenkov light in the Ring Imaging Cherenkov detector → measure of min. velocity • how can pions ever be mis-identified below 4.9 GeV/c? • Radiation of cherenkov light (≥ 4.9 GeV/c) • Production of delta electrons • Random coincidence (high multiplicity) • spherical mirror • parallel tracks produce rings at SAME location RICH
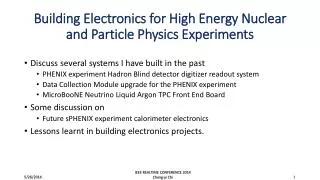
All charged tracks RICH cut Real Net signal Background Energy-Momentum Electron Identification II • electron: E ≈ p • hadron: E < p • after RICH cuts, clear electron signal • cut on E/p cleans electron sample! • background • photon conversions • random associations (next slide) • main background source: random combination of hadron track/shower with uncorrelated RICH ring • “standard” subtraction technique: flip-and-slide of RICH • swapped background agrees in shape with E/p distribution of identified hadrons • background increases with detector occupancy (can reach ~30% in central Au+Aucollisions) production and of el.magn. shower in the Electro- Magnetic Calorimeter → measure of energy E • PbSc: sampling cal., layers of lead and scintillator • PbGl: homogeneous lead-glass volume, Cherenkov radiator
Real - Mixed Real and Mixed e+e- Distribution PHENIX measures dielectrons • first attempt from 2002 Au-Au Run • S/B ~ 1/500 (!) for minimum bias events • not enough statistics • Au-Au data taken in 2004 • ~ 100x statistics • photon conversions reduced by factor 2-3 • expect background reduction by ~ 2
Detailed measurement of the e+e- pair continuum in p+p and Au+Au collisions at √sNN = 200 GeV and implications for direct photon production arXiv:0912.0244 422 authors 59 institutions 56 pages 50 figures 13 tables Submitted to Physical Review Con 1st December 2009 comprehensive results of dilepton measurements at RHIC.
Background • Type I: identified on a pair-by-pair basis: • Overlapping hits in the detectors (mostly RICH) • Photon conversions • Type II: cannot be identified on pair-by-pair basis removed statistically • Combinatorial Bcomb all combinations where the origin of the two electrons is totally uncorrelated • Correlated Bcorr • Cross pairs: Two pairs in the final state of a meson • Jet pairs: Two hadrons within the same jet or in back-to-back jets, decay into electron pairs
Overlapping pairs • when a pion points to the same ring as an electron, it is associated to the same ring, therefore considered an electronThis happens for a typical values of opening angle (different for like and unlike) which folded with the average momentum of the electron corresponds to a particular invariant mass (different for like and unlike) cut: requested minimum distance between the rings (~1 ring diameter) • Cut applied as event cut • Real events: discarded and never reused • Mixed events: regenerated to avoid topology dependence
z Dalitz decay Conversion pair z e- B B y y x e+ e- x e+ Photon conversion rejection • conversions “open” in a plane perpendicular to the magnetic field • artifact of PHENIX tracking • assume that all tracks originate from the vertex • off vertex tracks wrong momentum vector conversions are reconstructed with m≠0 (m~r)
Low-mass e+e- pairs: the problem • electrons/event in PHENIX • Ne = (dN/dh)p0 * (BR+CONV) * acc * f(pT>0.2GeV) 350 (0.012+0.02) 0.5*0.7 0.32 = 1.3 • combinatorial background pairs/event • B = ½ * ½Ne2e-N = 0.1 • expected signal pairs/event (m>0.2GeV, pT>0.2 GeV) • S = 4.2*10-4 signal/background • as small as 1/ few hundred • depends on mass • what can we do to reduce the combinatorial background? where does it come from? Signal to Background: S/B = 1 / 250
Conversion/Dalitz rejection? • typically only one “leg” of the pair is in the acceptance • acceptance holes • “soft” tracks curl up in the magnetic field • only (!) solution • catch electrons before they are lost • need new detector and modification of magnetic field
Consequences of poor S/Bcomb • how is the signal obtained? • unlike-sign pairs: F • combinatorial background: B (like-sign pairs or event mixing) • S = F – B • statistical error of S • depends on magnitude of B, not S • DS ≈ √2B (for S<<B) • “background free equivalent” signal Seq • signal with same relative error in a situation with zero background • Seq = S * S/2B • example: S = 104 pairs with S/B = 1/250 Seq = 20 • systematic uncertainty of S • dominated by systematic uncertainty of B • example: event mixing with 0.25% precision (fantastic!) ~60% systematic uncertainty of S (for S/B = 1/250)
Type II background • METHOD 1 • Combinatorial background: event mixing • Like and Unlike-sign pairs taking electons from different events • Normalize like-sign background to like-sign foreground in a region in (m,pT)where they agree • Normalize unlike-sign background to 2√N++N-- • Correlated background: simulations • Cross pairs: EXODUS • Jet pairs: PYTHIA • Normalize like-sign background to like-sign foreground • Normalize unlike-sign background in the same way • ADVANTAGE • Great statistics (much larger than foreground) • DISADVANTAGE • Assume simulation shape • Need independent normalization
Type II background • METHOD 2 • If dNlike = dNunlike S+- = N+- - 2√N++N— • In PHENIX dNlikedNunlike • But unlike-sign background B+- = 2√N++N-- can be corrected by acceptance difference • ADVANTAGE • This method measures ALL type II background simultaneously • only assumptions needed: • dNlike measures only background • Background symmetric in like and unlike • DISADVANTAGE • Poor statistics (similar to foreground)
Combinatorial Background shape • Shape determined with event mixing • Excellent agreements for like-sign pairs • Normalization of mixed pairs • Small correlated background at low masses • normalize B++ and B− − to N++ and N− − for mee > 0.7 GeV/c2 • Normalize mixed B+ − pairs toN+- = 2√N++N-- • Subtract correlated background • Systematic uncertainties • statistics of N++ and N-- : 0.12% • different pair cuts in like and unlike sign: 0.2 % --- Foreground: same evt N++ --- Background: mixed evt B++
Differential Combinatorial Background Centrality Dependence Transverse Momentum Dependence --- Foreground: same evt N++ --- Background: mixed evt B++
Combinatorial and Correlated Background p+p Au+Au • Combinatorial Background from mixed events normalized to 2√N++N-- • Cross pairs simulated with decay generator EXODUS • Jet pairs simulated with PYTHIA • normalized to like sign data and use same normalization for unlike-sign
Uncertainty of Background Subtraction p+p Au+Au • Method 1 and Method 2 • Variations of the two method • RMS Systematic Uncertainty
Ne Electron yield converter 0.8% 0.4% 1.7% With converter Photonic W/O converter Dalitz : 0.8% X0 equivalent radiation length Non-photonic 0 Material amounts: 0 Cross check Converter Method • We know precise radiation length (X0) of each detector material • The photonic electron yield can be measured by increase of • additional material (photon converter was installed) • The non-photonic electron yield does not increase • Photonic single electron: x 2.3 • Inclusive single electron :x 1.6 • Combinatorial pairs :x 2.5 Photon Converter (Brass: 1.7% X0)
The raw subtracted spectrum • Same analysis on data sample with additional conversion material • Combinatorial background increased by 2.5 Good agreement within statistical error ssignal/signal = sBG/BG * BG/signal 0.25% large!!! From the agreement converter/non-converter and the decreased S/B ratio scale error = 0.15±0.51%(consistent with the 0.25% error we assigned)
Efficiency Correction p+p Au+Au Trigger Efficiency (p+p) • Efficiency Correction: • Derived from single electron efficiency • Include detector dead areas • Include pair cuts • Same shape for p+p and Au+Au • p+p further corrected for trigger efficiency
Acceptance Correction • Acceptance Correction: • Derived from single electron acceptance • Compare • Hadron decays (full cocktail) • Flat distribution • in different mass regions as function of pT • Difference within ~10%
Hadronic Cocktail Measurement • Parameterization of PHENIX p±,p0 data p0 = (p++p-)/2 • Other mesons:fitwith mT scaling of π0pT→√(pT2+mmeson2-mπ2) fit the normalization constant • All mesons mT scale!!! • Hadroniccocktail was well tuned to individually measured yield of mesons in PHENIX for both p+p and Au+Au collisions. • Mass distributions from hadron decays are simulated by Monte Carlo. • p0, h, h’, w, f, r, J/y, y’ • Effects on real data are implemented arXiv: 0802.0050
Cocktail Comparison p+p PLB 670,313(2009) arXiv:0912.0244 Light hadron contributions subtracted Heavy Quark Cross Sections: • Charm: integration after cocktail subtraction σcc = 544 ± 39stat ±142syst ± 200modelμb • Simultaneous fit of charm and bottom: • σcc = 518 ± 47stat ± 135 syst± 190modelμb • σbb = 3.9 ± 2.4stat +3/-2systμb • Charm cross section from single electron measurement [PRL97, 252002 (2006)]: • σcc = 567 ± 57 ± 193 μb PLB 670,313(2009) • 2.25pb-1 of triggered p+p data • Data absolutely normalized • Excellent agreement with Cocktail • Filtered in PHENIX acceptance
Charm and bottom cross sections CHARM BOTTOM Dilepton measurement in agreement with measurement from e-h correlation and with FONLL (upper end) Dilepton measurement in agreement with single electron, single muon, and with FONLL (upper end) PLB670,313(2009) PRL103,082002 First measurements of bottom cross section at RHIC energies!
Cocktail Comparison Au+Au arXiv:0912.0244 • Low Mass Region:large enhancement 150 <mee<750 MeV • 4.7±0.4stat ±1.5syst ±0.9model • Intermediate Mass Region:dominated by charm (Ncoll x scc) • PYTHIA • Random cc correlation • Single electron measurement • High pT suppression • Flow • Expected modifications in the pair invariant mass random cc correlation? • Room for thermal contribution? • 800M min.BiasAu+Au events • Data absolutely normalized • Light hadrons cocktail • Charm normalized Ncoll x spp • Filtered in PHENIX acceptance
Centrality Dependence LMR arXiv:0912.0244 • p0 region: • consistent with cocktail • Low Mass Region: • yield increases faster than proportional to Npart • enhancement from binary annihilation (ππ or qq) ? arXiv:0912.0244
Centrality Dependence IMR arXiv:0912.0244 arXiv:0912.0244 • charm is a hard probe • total yield follows binary scaling (known from single e±) • intermediate mass yield shows the same scaling
Momentum Dependence p+p Au+Au arXiv:0912.0244 • p+p in agreement with cocktail • Au+Aulow mass enhancement concentrated at low pT
LMR I: Virtual Photons e+ q e- g* • Any source of real g can emit g* with very low mass. • If the Q2 (=m2) of virtual photon is sufficiently small, the source strength should be the same • The ratio of real photon and quasi-real photon can be calculated by QED Real photon yield can be measured from virtual photon yield, which is observed as low mass e+e- pairs g q Kroll-Wada formula S : Process dependent factor • Case of Hadrons • Obviously S = 0 at Mee > Mhadron • Case of g* • If pT2>>Mee2 • Possible to separate hadron decay components from real signal in the proper mass window.
Determination ofg* fraction, r r = direct g*/inclusive g*determined by fitting the following function for each pT bin. • fdirect is given by Kroll-Wada formula with S = 1. • fcocktail is given by cocktail components • Normalized to the data for m<30 MeV/c2 • Fit in 120-300MeV/c2(insensitive to p0 yield) • Assuming direct g* mass shape: c2/NDF=12.2/6 arXiv:0804.4168 arXiv:0912.0244
Direct measurement of S(mee, pT) Au+Au 200 GeVVaccuum HMBT @ pt=1.025 GeV/c Drop mass qq No indication of strong modification of EM correlator at this high pT region (presumably the virtual photon emission is dominated by hadronic scattering process like p+rp+g* or q+gq+g*) Extrapolation to M=0 should give the real photon emission rate R = (Data-cocktail)×Mee arXiv:0912.0244
directg*/inclusive g* arXiv:0804.4168 arXiv:0912.0244 p+p Au+Au μ = 0.5pT μ = 1.0pT μ = 2.0pT Base lineCurves : NLO pQCD calculations with different theoretical scales done by W. Vogelsang. • p+p • Consistent with NLO pQCD • better agreement with small µ • Au+Au • Clear enhancement above NLO pQCD
1st measurement of Thermal Radiation exp + TAA scaled pp • Direct photon • real (pT>4GeV) • virtual (1<pT<4GeV & mee<300MeV) • pQCD consistent withp+p down to pT=1GeV/c • Au+Au aboveNcoll x p+p for pT < 2.5 GeV/c • Au+Au = pQCD + exp: Tave = 221 19stat 19syst Fit to pp NLO pQCD (W. Vogelsang) arXiv:0804.4168 arXiv:0912.0244
arXiv:0912.0244 Comparison to Hydro models • From data: Au+Au= pQCD + exp: Tave= 221 19stat 19syst • Comparison to hydrodynamical models: • pT<3 GeV/c thermal contribution dominates over pQCD. • Assume formation of a hot QGP with 300 MeV < Tinit< 600 MeV0.6 fm/c < t0< 0.15 fm/c • Models reproduce the data within a factor of two. TC from Lattice QCD From data: Tini> 220 MeV > TC From models: Tini= 300 to 600 MeV t0= 0.15 to 0.5 fm/c
LMR II arXiv:0912.0244 arXiv:0912.0244 Large and broad enhancement S(mee) no longer const Towards lower pT R = (Data-cocktail)×Mee • Consistent with flat • S(mee) const • <R>=0.177±0.032 • Consistent with higher pT values
Extrapolate the spectrum of direct photons • For 0.8 < pT < 1.0 GeV/c<R> = 0.177±0.032 consistent with higher pT • Decay photons spectrum steeper than direct g spectrum • At lower pT, the expected direct photon fraction r = direct g / inclusive g = direct g / (direct + decay) g ≤ 0.17 • For 0.4 < pT < 0.6 GeV/cR(m) > 0.17 The enhancement in the low pT region is larger than that expected from internal conversion of direct photons.
Dilepton Spectra arXiv:0912.0244 p+p Au+Au Acceptance-corrected • p+p • Agreement with cocktail + internal conversion of direct photons • Au+Au • pT>1GeV/c: small excess internal conversion of direct photons • pT<1GeV/c: large excess for 0.3<mee<1 GeV • Low temperature component with strong modification of EM correlator?
Average Temperature of the sources arXiv:0912.0244 or • mT – m0 spectrum of Excess = Data – (cocktail+charm) • Fit: Direct g T2 consistent with Tg T1 = 92.0 ± 11.4stat ± 8.4systMeV T2 = 258.4 ± 37.3stat ± 9.6systMeV c2/NDF= 4.00/9 T1 = 86.5 ± 12.7stat+11.0-28.4systMeV Tg = 221 ± 19stat ± 19systMeV c2/NDF= 16.6/11 low mass enhancement has inverse slope of ~100 MeV.
Theory comparison • pp annihilation + modified r spectral function • Broadening • Mass shifting • Both • Insufficient to explain data arXiv:0912.0244
arXiv:0912.0244 Theory comparison II • High pT region:here we isolated a contribution arising from • p+rp+g*(typically included) • or • q+gq+g* (not included so far) Low pT region:where the enhancement becomes large and its shape seems incompatible with unmodified q+gq+g* Even when looking differentially in various pT bins the theoretical calculations are insufficient to explain the data