Download

1 / 21
210 likes | 341 Views
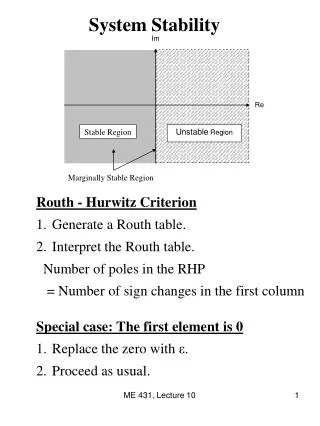
Stability Check for IEEE 118 Bus System. By G. Huang W. Wang Dept. of ECE Texas A&M University College Station, TX 77843. Task from RATC SOW.

E N D
Stability Check for IEEE 118 Bus System By G. Huang W. Wang Dept. of ECE Texas A&M University College Station, TX 77843
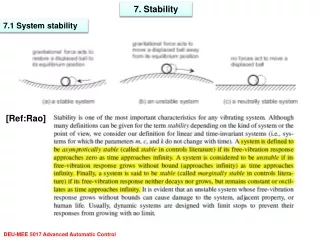
Task from RATC SOW According to the Statements of Work, our task for the second quarter of 2013 has almost been completed. AC feasibility and transient & voltage stability have been checked based on IEEE 118 bus system.
Task and Approach • Task: To check stability for a proposed line switching and generation re-dispatch. We use IEEE118_version2, by Dr. Hedman’s team as a benchmark. • Approach: Adopt TVA dynamic and control data to investigate stability of line switching and generation re-dispatch. Engineering insights are used to choose and design the whole system controls and tune control parameters. • Challenges: IEEE118 is an old test system without detailed dynamic data and controls. Activation times are not available from steady state solutions. Functionality of stability check component described in the Architecture document (Use cases 201 and 202)
Progress in the Last One and Half Quarters • More sophisticated controls, power system stabilizers (PSS) and exciters with proportional and integral (PI) controls, are used to enhance stability. Lead/lag compensator of governors are also tuned to enhance stability. • Our approach starts with lower loadings (50%) with rudimentary controls and gradually adding more sophisticated control for higher loading (now 110%). Accordingly, insights are obtained on requirements on stabilizing controls and their impacts on line switching/re-dispatch proposed by RATC algorithms are obtained. • Based on the obtained insights, we can fine tune control parameters with higher stability margin to cover heavier load. • As a consequence, our stability enhancing equipment and tuned control parameters enable the benchmark switching plan to pass stability check.
Dynamic Data Description • TVA control models and dynamic data is extracted for use in the IEEE 118 system. TVA control parameters are used as our initial setting. • To simplify our presentation, the same dynamic data is used for all the generators, as well as governors, exciters, and PSS (controls). • The P controller coefficient in the exciter model and the lead-lag time constants in the governor model are tuned to enhance system stability. • Exciters are more effective for line switching disturbances, governor compensators are more effective for re-dispatch disturbances. PSS has more coupling effect between the two.
Control Model Description An excitation system which includes PI controller is used. The governor used contains only the primary loop. The IEEE Dual-Input Stabilizer is used. Exciter model (ESST4B) IEEE Type ST4B Exciter Governor model (TGOV1) Steam Turbine-Governor PSS model (PSS2A) IEEE Dual-Input Stabilizer
Stability Check Results • Three timings for line switching and re-dispatch are used for insights: • First approach: Switch off lines one by one (50 seconds apart) and re-dispatch the generation at switching. (less line switching disturbances, focus on dispatch disturbance reactions) • Second approach: Switch off all the lines together and re-dispatch the end generation amount after 50 seconds. (focus on worst switching disturbance reactions) • Third approach: Switch off lines one by one (50 seconds apart) and re-dispatch the end generation amount after 50 seconds. • Switching off all the lines together may not be practical but it serves as the worst case scenario for line switching. If our stabilizing controls can survive for the case, then they can stabilize all other less strenuous cases.
Stability Check Results Simulation results are shown in the table below: * and are the P controller coefficient and I controller coefficient in the exciter model. is the lead-lag time constants ratio in the governor model. ** The results listed here is based on the simulation with 100% loading. ***is more critical to dispatch disturbances. ****1st approach fails after the third line switch, and 3rd approach fails after the 5th line switch.
Summary • For existing utility systems, the dynamic and control data are given and tuned seasonally and thus much easier to carry out user plan stability check (no design issue, and thus less testing and tuning for the system as we faced in test systems). • However, in case a line switching/re-dispatch plan fails stability check, our findings provide insight on what controls to add and how to tune control parameters to improve odds. • Our IEEE test plans progressed as follows: with p controls (in exciters), the line switching succeeds to 60% loading. With I controls and PSS added, it improves to 80% loading(Q1). Fine tuning p-parameters in exciters and governor lead/lag compensators make the switching succeed for 110% loading.
Summary • Insights on how the line switching/re-dispatch success depends on stabilizing controls are obtained. Different controls have different effects. • The feasibility of benchmarked line switching is demonstrated as a consequence. • Our findings on timing issue are follows: the less disturbance reactions introduced to the system, the better. Accordingly, we switch line one by one until facing breaker failures or tested stability failures (the best we can do to prepare our transmission system to deliver power) and then introduce the associated dispatch to reduce the re-dispatch disturbances (approach 3). • However, the worst case scenarios can be used for stabilizing control tunings!
Next Step With TVA System • Support the architecture effort by documenting Test Plan and Test Cases (using simulated and TVA test data) • Large-scale simulation and stability check with TVA system will be due on June 30th, 2014. • Power flow and dynamic data has been received from TVA. • Stability check based on TVA system will be carried out upon receiving of the switching and re-dispatch plan. • Study the test plan and tuning plan of control parameter tuning to enhance stability to better accommodate line switching and re-dispatch (make the user plans more likely to succeed) in the coming quarter.
Appendix : Simulation Results
Simulation Results The simulation results below are typical bus voltage and relative rotor angle plots. They show the system response after line switching and/or generation re-dispatch. Only voltage magnitude at bus 61 and relative rotor angle between bus 61 and 65 are selected because of space limitation.
Simulation Results--Continued Case 1. Kpr=5, T2/T3=1/15 Kpr=5, T2/T3=1/15 2nd approach Kpr=5, T2/T3=1/15 2nd approach
Simulation Results--Continued Kpr=5, T2/T3=1/15 1st approach Kpr=5, T2/T3=1/15 1st approach The 3rd approach introduces less disturbance into the system than the 1st approach. Kpr=5, T2/T3=1/15 3rd approach Kpr=5, T2/T3=1/15 3rd approach
Simulation Results--Continued Case 2. Kpr=5, T2/T3=1/5 Kpr=5, T2/T3=1/5 1st approach Kpr=5, T2/T3=1/5 1st approach
Simulation Results--Continued Kpr=5, T2/T3=1/5 2nd approach Kpr=5, T2/T3=1/5 2nd approach The 3rd approach introduces less disturbance into the system than the 2nd approach. Kpr=5, T2/T3=1/5 3rd approach Kpr=5, T2/T3=1/15 3rd approach Kpr=5, T2/T3=1/5 3rd approach
Simulation Results--Continued Case 3. Kpr=3.44, T2/T3=1/15 Kpr=3.44, T2/T3=1/15 1st approach Kpr=3.44, T2/T3=1/15 1st approach
Simulation Results--Continued Kpr=3.44, T2/T3=1/15 2nd approach Kpr=3.44, T2/T3=1/15 2nd approach The 3rd approach becomes unstable after switching off the 5th line and it introduces less voltage disturbance than the 2nd approach. Oscillatory Kpr=3.44, T2/T3=1/15 3rd approach Kpr=3.44, T2/T3=1/15 3rd approach
Simulation Results--Continued Case 4. Kpr=3.44, T2/T3=1/15 Kpr=3.44, T2/T3=1/5 2nd approach Kpr=3.44, T2/T3=1/5 2nd approach
Simulation Results--Continued Kpr=3.44, T2/T3=1/5 1st approach Kpr=3.44, T2/T3=1/5 1st approach Kpr=3.44, T2/T3=1/5 3rd approach Kpr=3.44, T2/T3=1/5 3rd approach The 3rd approach becomes unstable after switching off the 5th line while the 1st approach after the 3rd line. It also introduces less voltage and angle disturbance than the 1st approach.