Download
1 / 16
160 likes | 437 Views
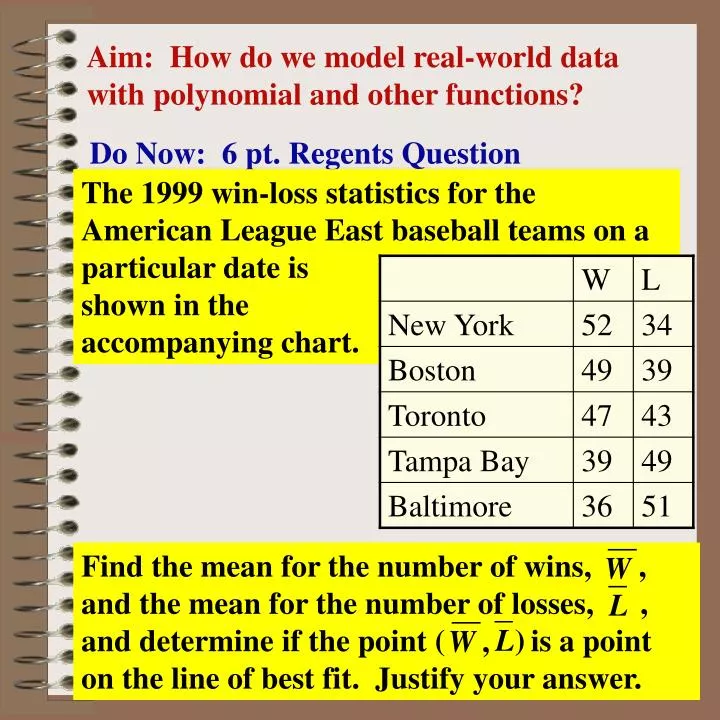
Aim: How do we model real-world data with polynomial and other functions?. The 1999 win-loss statistics for the American League East baseball teams on a particular date is shown in the accompanying chart.

E N D
Aim: How do we model real-world data with polynomial and other functions? The 1999 win-loss statistics for the American League East baseball teams on a particular date is shown in the accompanying chart. Do Now: 6 pt. Regents Question Find the mean for the number of wins, , and the mean for the number of losses, , and determine if the point ( is a point on the line of best fit. Justify your answer.
Model Problem The average daily amount of waste generated by each person in the United States is given below. This includes all wastes such as industrial wastes, demolition wastes, and sewage. y = .05x – 98.69 Create a scatter plot and determine the regression line. Round to nearest hundredth
Positive Correlation • y tends to increase as x increases • slope is positive • Negative Correlation • y tends to decrease as x increases • slope is negative No Correlation Correlation
0 < r< 0.5 positive/weak 0.75 <r< 1 strongly positive -0.5 <r < 0 moderately negative Correlation Co-efficient Data that are linear in nature will have varying degrees of goodness of fitto the lines of fit. The correlation coefficient r describes the nature of data. The closer the fit of the data to the line, the closer r gets to + 1 or -1
linear y = ax + b quadratic y = ax2 + bx + c quartic y = ax4 + bx3 +cx2 + dx + e cubic y = ax3+bx2+cx+d Real World Data & Poly Function Shapes No Direction Change 1 Direction Change 2 Direction Changes 3 Direction Changes
Which Function is Best Fit? Determine the type of polynomial function that could be used to represent the data in each scatter plot. Two direction change: cubic function would be best fit One direction change: quadratic function would be best fit
Determine Cubic Regression Equation and round coefficients to nearest integer STAT ENTER 6 Functions Modeling Data Write a polynomial function that models the set of data. cubic enter x into L1 enter f(x) into L2 View Stat Plot and determine which function best models the data f(x) = x3 – 3x2 + x – 5
STAT ENTER 5 Waste Problem The average daily amount of waste generated by each person in the United States is given below. This includes all wastes such as industrial wastes, demolition wastes, and sewage. quadratic 1 direction change Is a linear function the best fit for this data? y = ax2 + bx + c a = -.004209 b = .119480 c = 3.592550 R2 = .819795 Quadratic Regression y = -.004x2 + .119x + 3.593
Waste Problem y = -.004x2 + .119x + 3.593 a. Use the model to predict the amount of waste produced per day in 2010. Since 2010 is 30 years later than 1980, find f(30). f(30) = -.004x2 + .119x + 3.593 = 3.563 lb. b. Use the model to predict when waste will drop to 3 pounds per day. f(x) = -.004x2 + .119x + 3.593 = 3 x ≈ -4 or 34 1976 or 2014
Growth Decay Growth Decay Growth & Decay Exponential Functions y = abx Logarithmic Functions y = a + b ln x
Model Problem The table below gives the population of the world in billions for selected years during the 1900’s. Determine an equation that models the data.
y = ax + b a = .0435 b = .97409 r2 = .9008 r = .9491 y = a · bx a = 1.4457 b = 1.0136 r2 = .9700 r = .9849 Growth y = .04x + 1 y = 1.44 ·1.01x Growth & Decay
4 pt. Regents Question A biologist finds that a colony of bacteria grows exponentially and collects the following data on its size. On a grid, make a scatter plot of this data. Write an exponential regression equation, expressing the regression coefficients to the nearest tenth.
Natural Log Growth Model Problem The data in the table gives the yield y (in milligrams) of a chemical reaction after x minutes. Find a logarithmic model for the data y = 1.538+8.373 lnx
Oil Tanker Problem An oil tanker collides with another ship and starts leaking oil. the Coast Guard measure the rate of flow of oil from the tanker and obtains the data shown in the table. Write a polynomial function to model the set of data. f(x) = -0.4x2 + 2.8x + 16.3
Model Problem Write a polynomial function to model the set of data. f(x) = 2x3 – 3x2 – x + 4