Download
1 / 32
320 likes | 514 Views
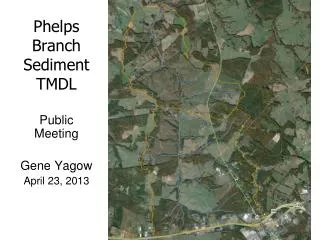
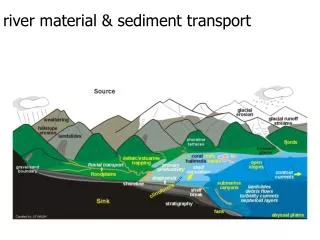
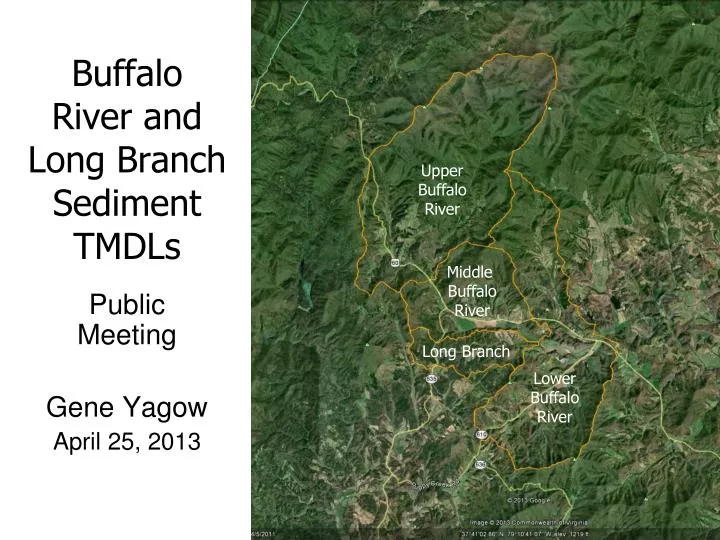
Buffalo River and Long Branch Sediment TMDLs. Upper Buffalo River. Middle Buffalo River. Public Meeting Gene Yagow April 25, 2013. Long Branch. Lower Buffalo River. Overview. Impairment Stressor Analysis → Sediment Watershed characterization GWLF sediment modeling

E N D
Buffalo River and Long Branch Sediment TMDLs Upper Buffalo River Middle Buffalo River Public Meeting Gene Yagow April 25, 2013 Long Branch Lower Buffalo River
Overview • Impairment • Stressor Analysis → Sediment • Watershed characterization • GWLF sediment modeling • Reference Watershed Approach • TMDL components • Allocation Scenarios
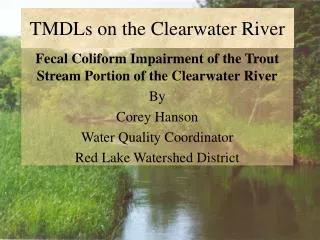
Biological Monitoring and Rating Healthy Impaired VSCI = Virginia Stream Condition Index
Biological Monitoring and Rating Healthy Impaired VSCI = Virginia Stream Condition Index
Stressor Analysis → Sediment • Long Branch • Poor habitat metric scores for: “Sediment Deposition” • > 50% mean Embeddedness • LRBS = 0.28 (LRBS > -0.5 indicates normal sediment load) • Buffalo River • Poor habitat metric scores for: “Riparian Buffer Zone Width” • > 50% mean Embeddedness • LRBS = - 0.32
Watershed characterization Watershed segmentation Land use Soils Slope “Future Growth” Existing BMPs
Future Growth • Simulation of a “future” land use condition • Assume growth is minimal in the watershed • Allocated construction permit area as 2% of developed land uses
BMP representation • DCR data downloaded by 6th order watershed for those BMPs relevant to sediment removal • None in the reference watershed, but several throughout the Long Branch and Buffalo River watersheds • BMPs are land use-specific • BMPs were credited as: • A land use change, or as • An efficiency applied to the applicable land use or to the upland area benefitted
TMDL Target Load Reducing load in the impaired watershed to the target TMDL load is expected to restore the benthic community Example Reference Watershed TMDL Impaired Load Non-impaired ImpairedWatershed TMDL Reference Watershed
Impaired and Comparison Watersheds Healthy VSCI Score Land use distribution Size Slope Elevation Physiographic region River basin Soil erodibility Beaver Creek Harris Creek Reed Creek Wreck Island Creek Fishpond Creek SF Falling River
Reference Watershed Selection • Fishpond Creek • Most similar land use distribution • Smallest drainage area
Reference Watershed Selection • Fishpond Creek • Most similar land use distribution • Similar elevation
HYSadj 4,252 ha Reference Watershed Area-adjustment Example HYS 20,789 ha TMB 4,252 ha
GWLF Sediment Loads Cropland Pasture Categories Developed Land uses LDI = low intensity developed; MDI = medium intensity developed; HDI = high intensity developed TMDL
GWLF Sediment Loads Cropland Pasture Categories Developed Land uses LDI = low intensity developed; MDI = medium intensity developed; HDI = high intensity developed TMDL
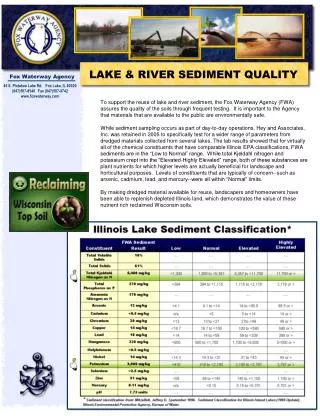
Permitted Sediment Loads (WLA) Industrial Stormwater General Permits *Average annual runoff simulated for the HDI land use category. Construction Permits *Average annual load simulated for the Barren land use category.
Long Branch Sediment TMDL Components • TMDL = WLA + LA + MOS • TMDL = area-adjusted load from reference watershed • WLA = permitted loads • MOS = margin of safety (10%) • LA = remaining load allocated for non-point sources
Buffalo River Sediment TMDL Components • TMDL = WLA + LA + MOS • TMDL = area-adjusted load from reference watershed • WLA = permitted loads • MOS = margin of safety (10%) • LA = remaining load allocated for non-point sources
Allocation Scenarios – Long Branch • Sediment load reductions are required • from “Future” Conditions in Long Branch • To the target allocation load Target Allocation Load = TMDL - MOS = 456.5 – 45.6 = 410.9 tons/yr
Allocation Scenarios – Buffalo River • Sediment load reductions are required • from “Future” Conditions in Buffalo River • To the target allocation load Target Allocation Load = TMDL - MOS = 4,414.8 – 441.5 = 3,973.3 tons/yr
Potential Sediment Reduction Targets Pastures with stream access Pastures with fair or poor conditions Eroding field roads Localized disturbed areas
Next Steps • Report will be available April 30, 2013 • Public comment open until June 13, 2013 • Finalize report and submit to EPA • Begin implementation planning
Contact Information Gene Yagow Biological Systems Engr. Dept. 306 Seitz Hall (0303)Virginia TechBlacksburg, VA 24061 eyagow@vt.edu540-231-2538