Download
1 / 30
330 likes | 501 Views
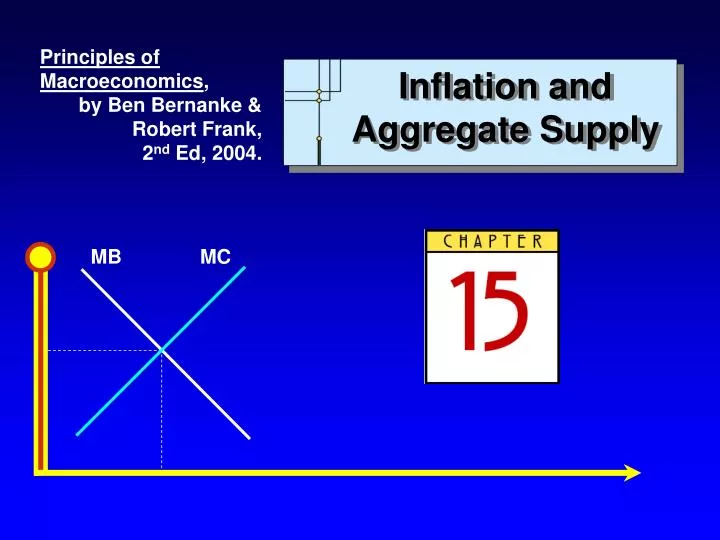
Principles of Macroeconomics , by Ben Bernanke & Robert Frank, 2 nd Ed, 2004. Inflation and Aggregate Supply. Inflation, Spending, and Output: The Aggregate Demand Curve. Aggregate Demand ( AD ) Curve

E N D
Principles of Macroeconomics, by Ben Bernanke & Robert Frank, 2nd Ed, 2004. Inflation and Aggregate Supply
Inflation, Spending, and Output: The Aggregate Demand Curve • Aggregate Demand (AD) Curve • Shows the relationship between short-run equilibrium output Y and the rate of inflation, • The name of the curve reflects the fact that short-run equilibrium output is determined by, and equals, total planned spending in the economy Chapter 15: Inflation and Aggregate Supply
Inflation, Spending, and Output: The Aggregate Demand Curve • Inflation, the Fed, and the AD Curve • The (simple) Keynesian model assumes output adjusts to demand at preset prices in the short run. • Prices do not remain fixed indefinitely. • The (simple) Keynesian model does not explain the behavior of inflation. Chapter 15: Inflation and Aggregate Supply
An increase in reduces Y (all other factors held constant) Aggregate Demand Curve AD The Aggregate Demand Curve Inflation Output Y Chapter 15: Inflation and Aggregate Supply
Inflation, Spending, and Output: The Aggregate Demand Curve • Inflation, the Fed, and the AD Curve • A primary objective of the Fed is to maintain a low and stable inflation rate. • Inflation is likely to occur when Y > Y* (Y* = Potential Output). • To control inflation, the Fed must keep Y from exceeding Y* Chapter 15: Inflation and Aggregate Supply
Inflation, Spending, and Output: The Aggregate Demand Curve • Inflation, the Fed, and the AD Curve • The Fed can reduce autonomous expenditure by raising the interest rate. • increases => rincreases => autonomous spending decreases => Y decreases (AD curve) Chapter 15: Inflation and Aggregate Supply
Inflation, Spending, and Output: The Aggregate Demand Curve • Other Reasons for the Downward Slope of the AD Curve (independent of Fed Policy) • Real Balance Effect (stored money wealth) • Distributional effects • Uncertainty • Prices of domestic goods and services sold abroad Chapter 15: Inflation and Aggregate Supply
Exogenous Spending: spending unrelated to Y or r • Fiscal policy • Technology • Foreign demand AD’ AD An increase in exogenous spending shifts AD to AD’ and vice versa Effect of An Increase In Exogenous Spending Inflation Output Y Chapter 15: Inflation and Aggregate Supply
AD New policy reaction function AD’ Old policy reaction function Fed “tightens” monetary policy – shifting reaction curve The new Fed policy increases r and AD shifts to AD’ A Shift In The Fed’s Policy Reaction Function Real interest rate set by Fed, r Inflation Inflation Output Y Chapter 15: Inflation and Aggregate Supply
A Virtuous Circle of Low Inflation and Low Expected Inflation Chapter 15: Inflation and Aggregate Supply
1. No output gap Inflation remains unchanged Y = Y* 2. Expansionary gap Inflation rises Y > Y* 3.Recessionary gap Inflation falls Y < Y* The Output Gap and Inflation Relationship of output to potential output Behavior of inflation Chapter 15: Inflation and Aggregate Supply
Inflation andAggregate Supply • The Output Gap and Inflation • If Y* = Y • An increase in exogenous spending creates and expansionary gap (Y > Y*) – inflation increases • A decrease in exogenous spending creates a recessionary gap (Y < Y*) and inflation decreases Chapter 15: Inflation and Aggregate Supply
Inflation andAggregate Supply • The Aggregate Demand—Aggregate Supply Diagram • Long-run aggregate supply (LRAS) • A vertical line showing the economy’s potential output Y* Chapter 15: Inflation and Aggregate Supply
Inflation andAggregate Supply • The Aggregate Demand—Aggregate Supply Diagram • Short-run Aggregate Supply (SRAS) • A horizontal line showing the current rate of inflation, as determined by past expectations and pricing decisions Chapter 15: Inflation and Aggregate Supply
Long-run aggregate supply, LRAS Short-run aggregate supply, SRAS A • Short-run equilibrium • Y: SRAS() = AD • Y < Y* -- recessionary gap • and Y adjust to the gap • decreases & Y increases Aggregate demand, AD Y Y* The Aggregate Demand-Aggregate Supply (AD-AS) Diagram Nominal interest rate i • Long-run equilibrium • AD, SRAS (*), LRAS (Y*) will intersect at the same point Output Chapter 15: Inflation and Aggregate Supply
Inflation andAggregate Supply • A Review of the Adjustment Process to a Recessionary Gap • Firms that are selling less than they want to will start to lower prices. • As falls the Fed lowers r and AD increases. • Falling reduces uncertainty which also increases AD Chapter 15: Inflation and Aggregate Supply
LRAS A SRAS B * SRAS’ AD Y Y* The Adjustment of Inflation When A Recessionary Gap Exists Inflation Output Chapter 15: Inflation and Aggregate Supply
Long-run aggregate supply LRAS • Short-run Eq. Y • Expansionary gap Y > Y* • rises, AD falls – Y falls • Long-run equilibrium at Y*, * B * SRAS’ A SRAS AD Y* Y The Adjustment of Inflation When A Expansionary Gap Exists Inflation Output Chapter 15: Inflation and Aggregate Supply
Increase in military spending causes AD to increase • Creates an expansionary gap -- Y > Y* • increases shifting SRAS to SRAS’ • Long-run equilibrium back to Y* with * LRAS LRAS C SRAS’ ’ B B SRAS SRAS A A AD’ AD’ AD Y* Y Y* Y War and Military Buildup As A Source of Inflation Inflation Inflation Output Output Chapter 15: Inflation and Aggregate Supply
Equilibrium @ A--Y* = Y LRAS • Inflation shock, increases to ‘ (SRAS’) • Short-run eq. At B, Y < Y*; recessionary gap and higher inflation (stagflation) • No policy -- falls; long-run eq. at A • With policy--AD shifts to AD’; Y = Y*; rises to * B C ’ SRAS’ A SRAS AD’ AD Y’ Y* The Effects of An Adverse Inflation Shock Inflation Output Chapter 15: Inflation and Aggregate Supply
Equilibrium at A -- Y* = Y LRAS’ LRAS • Y* falls to Y*’ • Y > Y* -- expansionary gap • increases--SRAS rises to SRAS’ • Equilibrium at B • Y = Y*’ • increased to ‘ • Decline in output is permanent B ’ SRAS’ A SRAS AD Y*’ Y* The Effects of a Shock To Potential Output Inflation Output Chapter 15: Inflation and Aggregate Supply
Sources of Inflation • Shocks to Potential Output • Aggregate supply shock • Inflation shocks • Stagflation • Temporary reduction in output Chapter 15: Inflation and Aggregate Supply
Sources of Inflation • Shocks to Potential Output • Aggregate supply shock • Potential output shocks • Stagflation • Permanent reduction in output Chapter 15: Inflation and Aggregate Supply
Sources of Inflation • Economic Naturalist • Why was the United States able to experience rapid growth and low inflation in the latter part of the 1990s? Chapter 15: Inflation and Aggregate Supply
U.S. Macroeconomic Data, Annual Averages, 1985-2000 % Growth in Unemployment Inflation Productivity Years real GDP rate (%) rate (%) growth (%) 1985-1995 2.8 6.3 3.5 1.4 1995-2000 4.0 4.6 2.4 2.5 Chapter 15: Inflation and Aggregate Supply
Equilibrium at B -- Y*’ = Y LRAS’ LRAS • Productivity increases • Y*’ shifts to Y* • Recessionary gap -- Y*’ < Y* • falls to • Equilibrium at A • Lower inflation; higher output B ’ SRAS’ A SRAS AD Y*’ Y* Economic Naturalist Inflation Output Chapter 15: Inflation and Aggregate Supply
LRAS B A SRAS 10% • Eq. At A (Y = Y*) • = 10% • Fed shifts AD to AD’ • Short run eq. At B • Y < Y* -- recessionary gap • Long run correction occurs AD AD’ Y Y* Short-Run Effects of an Anti-inflationary Monetary Policy Inflation Output Chapter 15: Inflation and Aggregate Supply
falls to 3% and Y rises to Y* • Long-run eq. -- lower prices @ Y* SRAS’ 3% Long-Run Effects of an Anti-inflationary Monetary Policy LRAS B SRAS 10% • Short-run eq. at B • Recessionary gap -- Y < Y* Inflation C AD’ Y Y* Output Chapter 15: Inflation and Aggregate Supply
U.S. MacroeconomicData, 1978-1985 Nominal Real % Growth in Unemployment Inflation interest interest Years real GDP rate (%) rate (%) rate (%) rate (%) 1978 5.5 6.1 7.6 8.3 0.7 1979 3.2 5.8 11.4 9.7 -1.7 1980 -0.2 7.1 13.5 11.6 -1.9 1981 2.5 7.6 10.3 14.4 4.1 1982 -2.0 9.7 6.2 12.9 6.7 1983 4.3 9.6 3.2 10.5 7.3 1984 7.3 7.5 4.3 11.9 7.6 1985 3.8 7.2 3.6 9.6 6.0 Chapter 15: Inflation and Aggregate Supply
End of Chapter