Download
1 / 18
180 likes | 268 Views
Multi-Satellite Remote Sensing of Global Surface Water Extent and Volume Change. Fabrice PAPA (1), Catherine PRIGENT (2), William B. ROSSOW (1), Elaine MATTHEWS (3), Andreas GUNTNER (4), Frederic FRAPPART (5) et al (6). (1) NOAA-CREST-CCNY, New York, USA

E N D
Multi-Satellite Remote Sensing of Global Surface Water Extent and Volume Change. Fabrice PAPA (1), Catherine PRIGENT (2), William B. ROSSOW (1), Elaine MATTHEWS (3), Andreas GUNTNER (4), Frederic FRAPPART (5) et al (6). (1) NOAA-CREST-CCNY, New York, USA (2) LERMA-Observatoire de Paris, Paris, France (3) NASA-GISS, New York, USA (4) GFZ, Postdam, Germany (5) CESBIO, Toulouse, France (6) LSCE, Paris/ IRD, Brasilia/ LEGOS, Toulouse/ UCI, Irvine …. Mail to: papa@ee.ccny.cuny.edu fpapa@giss.nasa.gov
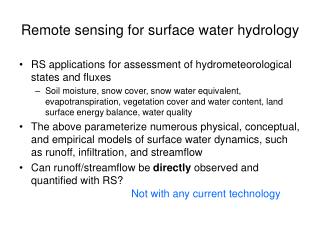
Continental Surface Waters and their Roles They play a crucial role in the global biochemical and hydrological cycles The largest methane source (~ 20-40%), a powerful greenhouse gas The only CH4 source dominated by short-term climate variations Important compartment of continental water storage, regulate the local river hydrology Part of the fresh water input in the ocean via river discharges Sources for recharching ground water supplies. Role in present sea level rise? Surface Water extent and storage is crucial to measure However: incomplete knowledge of seasonal and inter-annual variability at regional to global scales
What before SWOT? We are currently trying to develop new methods which match with SWOT goals: 1) Multi-year global dataset of surface water extent using multi-satellite methods Applications: - dynamic of surface water extent, roles in the water/energy cycle - evaluation of hydrological models/ input for hydrological models - methane emissions studies 2) Dataset of surface water volume change combining multi-satellite methods First for specific area: Rio Negro, Ganges… But with an ultimate goal to do so at global scale Applications: - large scale hydrology, decomposition of GRACE components - contribution of continental water to sea level rise
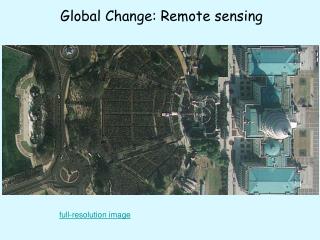
Mean fractional surface water extent at annual maximum Dynamic of surface water extent at global scale 1) Global surface water extent from multi-satellite method Merging of satellite data with different wavelengths (surface classification, NN, vegetation) Passive microwave SSM/I emissivities at 19, 37 GHz, H and V polarizations Active microwave ERS scatterometer backscattering coefficient at 5.25 GHz Visible and near infrared AVHRR NDVI (visible and near-infrared reflectances) % • Data mapped on equal-area grid with 0.25°x0.25° resolution at equator (773 km²) • Monthly resolution for 1993-2004 (soon 5 days) and at least extended to 2012 and longer [Prigent et al, 2001; Prigent et al, 2007 Papa et al., 2006, 2007,2008]
Dynamic of surface water extent at global scale Global and zonal temporal variations of inundated surfaces extent Global results: maximum extent: ~6.7 million km², strong seasonal cycle and inter-annual variability Deseasonalized anomalies: decrease of surface water extent especially over the Tropics Need of validation, comparison, evaluation of these results
Surface water extent at global scale: the Amazon case study SAR estimates (100m) Multi-Satellites derived estimates (~25 km) Good agreement between the SAR-derived estimates and the Multi-Satellites derived estimates Some differences at higher and lower stage for small and large extents (<10%; >90%) But comparison only for 2 months in 1995-1996. SWOT will provide direct comparisons over longer period and different environments [Prigent et al, 2007, JGR]
Surface water extent at global scale: the Amazon basin case study GPCC rain Surface water extent In-Situ River discharge Only 1 point of discharge available to us Surface water extent River height from altimeter In-situ river level height Now with current altimeters and in-situ gauges, evaluation is possible only for few points over the Amazon. SWOT will provide more data to compare with and with much more details.
Surface water extent, the coastal regions case Over the Tropics, comparison with the trend in the density of population 1990-2005 for coastal regions Trend in surface water extent Trend in the population density South Mexico Good spatial agreement between the decrease in SW extent and the increase in the density of population (this has been checked for other locations), at least from 1990 to 2005 Madras, India Hanoi, Vietnam The SWOT high spatial resolution will help better understand in details what we are currently observing on the coast at ~25km Interval
Global Surface water extent dynamic: high demand from the “methane” community Wetlands are the bigger contributors to the interannual variability in methane emissions CH4 emissions from wetlands estimated from multi-sat. method Since 1999, compensation between an increase in anthropogenic emission and a decrease in CH4 emissions from wetlands Bousquet et al, Nature, 2006 SWOT will help characterizing wetland dynamics for CH4 model emission
Surface water volume change Using the surface water extent dataset to get surface water volume change Surface water extent GPCC rain WGHM surface storage GRACE total storage
Surface water volume change Good agreement between GRACE, SWE, WGHM, altimeter river height
Altimeter track (T/P) In situ gauge station Altimeter station Surface water volume change Test area Rio Negro basin (700 000 km²) for altimetry-based approach
Water level maps Surface water volumes 7 1 Surface water storage 1) Surface water volumesby combination of inundation extent with water levels from altimetry Water levels from Topex/Poseidon and ENVISAT RA-2 and in situ gauges data Bilinear interpolation Inundation map [Frappart et al., JGR, 2008]
Surface water storage 2) Surface water volumesby combination of inundation extent with topographic data
Mean seasonal amplitudeof water storage change Surface water storage change: Rio Negro basin case study Surface water volume change from multi-sat/alti is ~ 38% of Grace total storage When developed at global scale, this approach could be an opportunity to evaluate SWOT products at regional/global scale We could also construct 2 decades of surface water volume to complete backward the SWOT measurements GRACE DEM Alti. WGHM
Why SWOT would be great: Given what we are observing at large scale with the “crude” 25 km interval sampling surface water extent dataset, SWOT will provide opportunities to better understand: Why surface water extent is declining at global scale and especially over the Tropics, at least from 1993 to 2005 The decrease in coastal regions thanks to its high resolution The interannual variability in methane emissions (and trends?) The up-coming surface water volume change at global scale will provide a dataset to compare with SWOT measurements at least at the large scale.