Download
1 / 18
180 likes | 264 Views
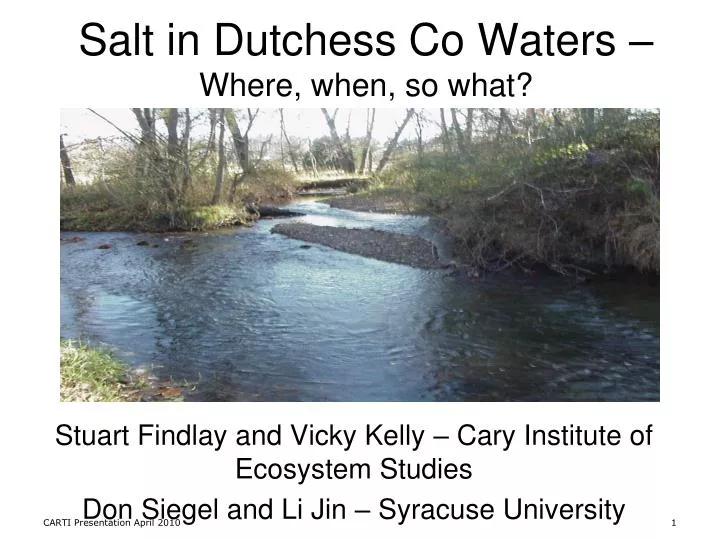
Salt in Dutchess Co Waters – Where, when, so what?. Stuart Findlay and Vicky Kelly – Cary Institute of Ecosystem Studies Don Siegel and Li Jin – Syracuse University. Some Chloride Reference Points. Background - ~ 10 mg/L or less [Catskill Reservoirs]

E N D
Salt in Dutchess Co Waters –Where, when, so what? Stuart Findlay and Vicky Kelly – Cary Institute of Ecosystem Studies Don Siegel and Li Jin – Syracuse University
Some Chloride Reference Points • Background - ~ 10 mg/L or less [Catskill Reservoirs] • Sublethal – 50-100 mg/L Subtle yet Significant • Biotic Indices • Microbial processes • Associations • EPA Chronic – 230 mg/L • Drinking Water Std – 250 mg/L • EPA Acute – 860 mg/L • Lethal - 1000 or higher
SIMPLER • REFERENCE <10 mg/L • ENVIRONMENTAL EFFECTS ~ 100 mg/L • LETHAL > 1000 mg/L DUTCHESS COUNTY WATERS 80 mg/L (+/- 79 SD)
Dutchess County Chloride (mg/L) Crum Elbow 15-50 Ten Mile 10-40 Casperkill 100-300 (Cunningham et al 2009) Wappinger 10-45 Fishkill 10-100
DC WC Mullaney et al., USGS
THE UNEXPECTED • Long-term increases in concentration • High concentrations in summer • Higher concentrations downstream (in summer)
Long-term IncreaseSaw Kill CreekHRNERR • Low-density residential • Yearly mean Cl-concentrations have doubled since 1991 (20 to 40 mg/L) • Similar Cl- concentrations throughout year
No decline in summer concentrations High concentrations in summer • East Branch Wappinger Creek, Millbrook
Downstream increases insummer New York State FISHKILL CREEK Summer 2005 Population Mouth Headwaters
Fig. 4: Frequency distribution of chloride concentrations in surface and well samples from Dutchess County. Groundwater / Surfacewater Private drinking-water wells Non-random but widely distributed A few wells have Cl > surface water concentration – Could support high baseflow concentrations
Residential Land Cover and Chloride (M. Essery) Subwatersheds in the Fishklill Basin
Sources of Chloride(% of flux in Fishkill Creek) (>80%) (5-10%) (~1%)
CHLORIDE IS NOT ALONE – ASSOCIATED WITH OTHER CONTAMINANTS D. Burns - EMC
Event – Dec 24-27, 2008Fishkill Creek at Beacon Exposure at “peak” concentration equivalent to about twice as long at “baseline” concentration
An Engaging Problem? • Everyone understands “salt”-opportunity for education • Not viewed as a threatening issue -not (presently) a health hazard or regulated material • Point sources don’t always seem to be the problem (no finger-pointing, low media attention) • Chloride is associated with nitrate so trend may suggest presence of other contaminants
The Future? Scenario Tests • Scenario 1--Reducing road salt application by half • Cl decreases up to 20.7% at mouth • Scenario 2- --Doubling road salt application • Cl increases up to 34.2% at mouth 2X Base -50% Jin et al. 2011