Download
1 / 15
150 likes | 242 Views
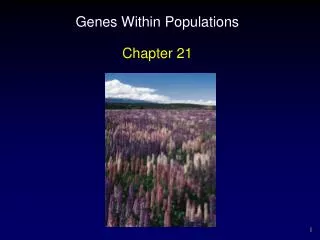
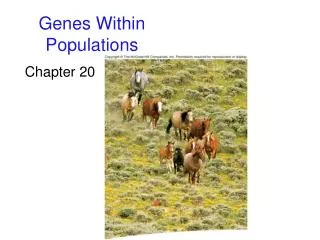
Genes in populations. Xuhua Xia xxia@uottawa.ca http://dambe.bio.uottawa.ca. MUTATIONS vs POLYMORPHISMS. Polymorphisms - two or more natural variants (alleles, phenotypes, sequence variants) which occur at “significant” frequencies in a population.

E N D
Genes in populations Xuhua Xia xxia@uottawa.ca http://dambe.bio.uottawa.ca
MUTATIONS vs POLYMORPHISMS Polymorphisms - two or more natural variants (alleles, phenotypes, sequence variants) which occur at “significant” frequencies in a population if present in < 2% population, called “mutation or “mutant allele” Alleles - alternative forms of a gene (or DNA sequence) at a particular locus (chromosomal site) • frequency in population determined by natural selection • and random genetic drift if allele frequency = 1, FIXATION if allele frequency = 0, EXTINCTION (LOSS)
Integration y MAPLE commands: y:=sqrt(r^2-x^2); A:=4*int(y, x=0..r); use RealDomain in simplify(A) end; x r x x1 x2 x3 x4
Basic population genetics Co-dominance: Genotype A1A1 A1A2 A2A2Fitness w11 w12 w22Frequency p2 2pq q2 Genotype A1A1 A1A2 A2A2Fitness w11=1 w12=1+s w22=1+2s MAPLE commands: eq1:=diff(q(t),t)=s*q(t)*(1-q(t)); ics:=q(0)=q0; eq2:=dsolve({eq1,ics},q(t)); Dominance Overdominance and underdominance Note that q = 0 when w11 = w12 = w22, i.e., allele frequencies will not change when there is no selection.
Dynamics of gene substitution Advantageous mutations Neutral mutations _ t = mean conditional fixation time 1/K = mean time between 2 consecutive fixation events Fig. 2.7 K = rate of substitution (# mutations fixed per unit time)
Neo-Darwinism and Neutralism Natural selection for advantageous mutations which improve fitness is primary source of genetic variation “Survival of the fittest” NEUTRAL THEORY OF MOLECULAR EVOLUTION (Kimura) At molecular level, most evolutionary changes occur by random genetic drift of alleles which are selectively neutral (or nearly so) “Survival of the luckiest” BUT …. presence of different neutral alleles in population important eg. if environment changes, certain alleles may be advantageous & selected
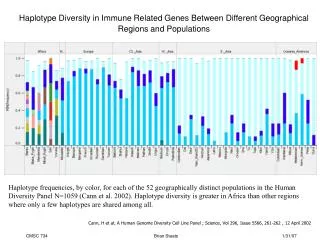
Observations leading to Kimura’s theory 1. Relatively high rate of amino acid sequence evolution - variable among proteins, but in many cases about 0.5 – 1.5 x 10⁻⁹ changes per non-synonymous (ie. amino acid-altering) site per year (Table 4.1) 2. Relatively constant rate of evolution for given protein over time - based on pairwise comparisons of proteins (eg a-globin) among species (Figure 4.15) “Molecular clock” 3. Rate of evolution can differ along protein sequence - functionally important regions (eg active site of enzyme) change at slower rate (Figure 4.5) 4. High degree of genetic variation (polymorphisms) within populations (Figure 2.9)
Evolutionary theories Bromham & Penny “The modern molecular clock” Nature Rev Genet 4:216, 2003 Selectionist theory: assumption that all mutations affect fitness Neutral theory: for most proteins, neutral mutations exceed advantageous ones (and more neutral sites would produce a faster overall rate of change Nearly neutral theory: fate of mutations with only slightly positive or negative effect on fitness will depend on factors like population size
Running the Gel These bands are invisible without staining. Gel Samples
Multiple Paternity Detected Mother Loci Genotype Offspring Genotype PGM-3 BB BB BB BC BC BC BD BB AB AB AB BB BC BD BB AB AB BB BB BD BD AB AB AD AD AD BC BC BC BB AB AB BB BB BB BC BD BB BB BC BC BC BC BD BD BD BB AB AB AB BB BB BC BC BC BB BB BB BC BC BC BC BC BD BD AMY-2 AC AA AB AC AC AC CC CC BB AB AB AB AB BB BC BC BB AB BB BB BB BB BB BC BC From Boonstra, Xia and Pavone 1993
Human Impact and Extinction 1598-1681
DNA Fingerprints of Unrelated Lions Serengeti Gir