Download
1 / 17
170 likes | 289 Views
Modeling volcanic and marine emissions for Hawaii Air Quality Forecast. Daniel Tong*, Pius Lee, Rick Saylor, Mo Dan, Ariel Stein, Daewon Byun NOAA Air Resources Laboratory (ARL), Silver Spring, MD 20910 Xiaoming Liu and Kent Hughes

E N D
Modeling volcanic and marine emissions for Hawaii Air Quality Forecast Daniel Tong*, Pius Lee, Rick Saylor, Mo Dan, Ariel Stein, Daewon Byun NOAA Air Resources Laboratory (ARL), Silver Spring, MD 20910 Xiaoming Liu and Kent Hughes NOAA Center for Satellite Applications and Research (STAR), Camp Spring, VA Andrew Jeff Sutton, Tamar Elias, James Kauahikaua USGS Hawaiian Volcano Observatory, Hawaii National Park, HI 96718 * Email: daniel.tong@noaa.gov Acknowledge: Jianping Huang of NCEP for helps with model simulations; US EPA and CSC for providing emission inventories and spatial surrogates; NOAA ARL AQUEST group for technical support and discussion. Air Resources Laboratory
Hawaii domain: area, mobile, point; biogenic emissions; Sea-salt emissions; Volcanic emissions? Marine emissions? Hawaii Air Quality Forecast Air Resources Laboratory
Anthropogenic Emission: • Area, mobile, and point emissions based on EPA NEI 2005 Anthropogenic & biogenic Emission in Hawaii Natural Emission: • Biogenic emissions by BEIS 3.14 and USGS LULC data (H. Kim); • Sea-salt emissions along coast lines (B. Wang); Air Resources Laboratory More details at http://www.emc.ncep.noaa.gov/mmb/aq/AQChangelogOE.html
Eiso - Isoprene emission; • Shaw et al. (2003): [Chl-a] - Isoprene emission; A Review of Approaches for Marine Isoprene Emissions V – euphotic water volume; • Palmer & Shaw (2005): EF – Emission factor; kAS – exchange coeff.; CW – isop. conc. in water ki – chemical reaction rate for oxidant i; CA – isop. conc. in the air kbio – bacterial loss rate; H – Henry’s law constant; LMIX – loss due to downward mixing; P – isoprene production; • Gantt et al. (2009): Hmax – euphotic zone height; ZML – mixing layer height; Air Resources Laboratory
Overall emission flux into the atmosphere (Palmer and Shaw, 2005): Estimating marine Isoprene Emissions • Determine CW: (Palmer and Shaw, 2005) (Revised based on Gantt et al.) • Derive Hmax: (Gantt et al. 2009) I0 – ground radiatioin; K490 – defuse attenuation coefficient in water Air Resources Laboratory
Chlorophyll-a and K490 • Sensor/Satellite: Moderate Resolution Imaging Spectroradiometer (MODIS) on Aqua • Data Processing Levels (NOAA CoastWatch http://coastwatch.noaa.gov): - Level 1: NOAA obtains data from NASA GSFC in 5-minute granules, and process to geolocated, calibrated radiances - Level 2: Processed to derived MODIS data products (Chl-a, K490, nLw, etc.) - Level 3: Products are mapped to the CoastWatch geographic regions • Algorithms (NOAA CoastWatch): • Chlorophyll-a concentration: OC3 Algorithm • Diffuse attenuation coefficient at 490 nm (K490): J. Mueller Algorithm Chlorophyll -a K490 6
Raw Daily [Chl-a] and K490 K490 cut-off (= 0.016) Sensitivity to input parameter: K490 Air Resources Laboratory
Sensitivity to input parameter: [Chl-a] Daily [Chl-a] and K490 Monthly [Chl-a] and K490 Using monthly, instead of daily, average [Chl-a] and K490 reveals larger source area for marine isoprene emissions. 10/22/2014 Air Resources Laboratory 8
Terrestrial vs. marine isoprene emissions (Preliminary Results) Land Emission Marine Emission • Monthly [Chl-a] and K490; • K490 cut-off (= 0.016); • Hourly ground radiation (I0); 10/22/2014 Air Resources Laboratory 9
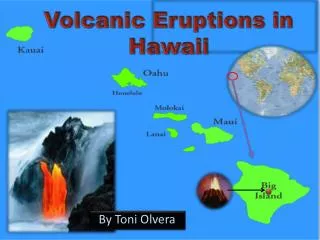
Volcano SO2 Emissions in Hawaii Air Resources Laboratory A pulse of magma moving through Kīlauea's east rift zone
Kilauea Volcano over the Hawaii Island Air Resources Laboratory (Source: Hawaiian Volcano Observatory: http://hvo.wr.usgs.gov)
Methodology for Modeling Volcanic Emissions Daily web update In-Situ SO2 Measurement Pre-processor Emission Processing Hawaiian Volcano Observatory NOAA Air Resources Lab • SO2 measurement Correlation Spectrometer (COSPEC); • Simple plume rise: Distributed from ground to 100 m above; Air Resources Laboratory
Plume Rise of Volcanic Emissions Make it simple since we know so little about it… ~130 m • Multiple and moving emitting points; • Emitting point below surface; • Dynamic magma movement; • Difficult to implement plume rise algorithms, such as Briggs (1972). 10/22/2014 Air Resources Laboratory 13
Kilouea SO2 Emissions (Source: Hawaiian Volcano Observatory: http://hvo.wr.usgs.gov) 10/22/2014 Air Resources Laboratory 14
Volcano SO2 emissions (July 24 – 29, 2010): • Summit Emissions: 650 - 800 tons/day; • East Rift Zone: ~400 tons/day; Model Configurations • CMAQ • CB05-AQ-AERO4 gas, aqueous and aerosol chemistry • Domains • 80 x 52 grid cells • Horizontal resolution: 12x12 km2 • Vertical level: 22 layers • Meteorological inputs • NAM WRF- NMM 12 km • Lateral boundary conditions (Fantine Ngan) • GEOS-Chem precursors with Hilo monthly mean ozonesonde 15 Air Resources Laboratory
SO2 O3 Effects on Air Quality H2O2 Sulfate Nitrate Air Resources Laboratory
Methods to estimate near real-time emissions from two additional natural sources: volcano and marine phytoplankton. • Due to its unique emission pattern and reliable measurements, SO2 emissions from Kilauea volcano can be incorporated into the NAQFC system; • In comparison, marine phytoplankton emissions are more challenging to estimate due to both input data quality and lack of knowledge on how to deal with these uncertainties. Concluding Remarks Air Resources Laboratory