Download

1 / 22
230 likes | 427 Views
North Carolina Aging Demographics. Prepared by the UNC Institute on Aging. Last updated October 2007. Population Is Getting Older. Older adults are the fastest growing segment of North Carolina’s population.

E N D
North Carolina Aging Demographics Prepared by the UNC Institute on Aging Last updated October 2007
Population Is Getting Older • Older adults are the fastest growing segment of North Carolina’s population. • Number of elderly people (65+) in the state will more than double between 2000 and 2030, increasing from 969,000 in 2000 to 2.145 million by 2030. • Number of oldest old (85+) will much more than double during this time period, increasing from 105,000 in 2000 to 258,000 in 2030. • Reasons include: natural increase (births minus deaths), increased life expectancies, and net migration into the state. Prepared by the UNC Institute on Aging Source of data: North Carolina State Demographics Unit, “Past and Expected Trends.”
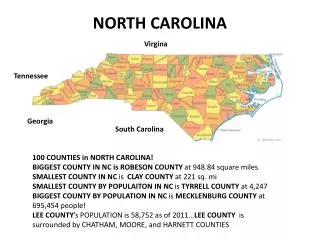
65+ Population in 1990 Counties with over 15% of total population 65+ Statewide: 12% Prepared by the UNC Institute on Aging Source of data: North Carolina State Demographics Unit, Census 1990.
65+ Population in 2000Counties with over 15% of total population 65+ Statewide: 12% Prepared by the UNC Institute on Aging Source of data: North Carolina State Demographics Unit, Census 2000.
65+ Population in 2020Counties with over 15% of total population 65+ Statewide: 15% Source of data: North Carolina State Demographics Unit, “Projected County Totals – Standard Age Groups,” July 1, 2020. Prepared by the UNC Institute on Aging
Population Shift in North CarolinaPercent of Population by Age Group (1970-2030) Prepared by the UNC Institute on Aging Source of data: U.S. Census Bureau and North Carolina State Demographics Unit.
Life Expectancies At Birth Prepared by the UNC Institute on Aging Source of data: North Carolina State Demographics Unit, “North Carolina Life Expectancies.”
Life Expectancies at Age 65 Prepared by the UNC Institute on Aging Source of data: North Carolina State Demographics Unit, “North Carolina Life Expectancies.”
How Many Years of Good Health? Minority men and women in North Carolina don't live as long as whites, yet they have more years of poor health. Prepared by the UNC Institute on Aging Source of data: CDC, Chronic Disease Notes & Reports, vol. 16, no. 2/3 (2004).
Leading Causes of DeathNorth Carolina Residents Age 65+ (2005) Chronic diseases are responsible for 65% of all deaths in North Carolina. Many of the leading causes of death for North Carolinians – including heart disease and diabetes – can be prevented. Heart Disease Cancer Cerebrovascular Disease Chronic Respiratory Diseases Alzheimer’s Diabetes Source of data: North Carolina State Center for Health Statistics, North Carolina Vital Statistics, Volume 2: Leading Causes of Death – 2005. Table A: Leading Causes of Death by Age Group. Prepared by the UNC Institute on Aging
More Older WomenNorth Carolina Population by Gender and Age (2005) All Ages Age 65+ Age 85+ Male28.2% Male49.3% Male41% Female50.7% Female59% Female71.8% Source of data: North Carolina State Demographics Unit, “County/State Population Estimates,” Certified 2005. Prepared by the UNC Institute on Aging
Racial & Ethnic DifferencesComposition of 65+ Population (2005 estimates) In North Carolina: Overall U.S. White: 85.3% Black: 8.3% American Indian: .5% Asian: 3.2% Some Other Race: 2% Two or More Races: .7% Hispanic*: 6.4% Black 15.5% American Indian.9% Asian .7% Hispanic*.8% White 82.3% *Note: Persons of Hispanic origin may be of any race; estimates for “Some other Race” in NC is .2% and “Two or More Races” in NC is .4%.Source of data: U.S. Census Bureau, 2005 American Community Survey. Prepared by the UNC Institute on Aging
Proportion of Older Minorities Source of data: North Carolina State Demographics Unit, “County/State Population Projections.” Prepared by the UNC Institute on Aging
Educational Attainment Education Levels of Older Adults (2000) Prepared by the UNC Institute on Aging Source of data: U.S. Census Bureau, Census 2000 Supplementary Survey, Table PCT033.
Older Adults Migrate to North Carolina Number of adults age 60+ who lived in a different state 5 years earlier Source of data: 1970-1990 data from Dr. Charles Longino; 2000 data from Internal Migration of the Older Population: 1995 to 2000 (CENSR-10). Prepared by the UNC Institute on Aging
Net Migration Prepared by the UNC Institute on Aging
North Carolina vs. NationwidePercent of 65+ population (2005 estimates) Prepared by the UNC Institute on Aging Source of data: U.S. Census Bureau, 2005 American Community Survey.
Older Workers in North CarolinaPercent of NC population in the labor force (2000) Prepared by the UNC Institute on Aging Source of data: U.S. Census Bureau, Census 2000 Supplementary Survey Table PCT047.
Health Professionals In Short Supply Source: North Carolina Rural Health Research Program, Cecil G. Sheps Center for Health Services Research, University of North Carolina at Chapel Hill Prepared by the UNC Institute on Aging
Medicaid Eligibility of Older Adults in NC Source: NC Division of Medical Assistance, Medicaid in North Carolina: Annual Report State Fiscal Year 2006. Prepared by the UNC Institute on Aging
North Carolina Population Pyramids (1960 & 1990) Prepared by the UNC Institute on Aging Source of chart: UNC Chapel Hill, School of Social Work, CARES & NC Division of Aging.
North Carolina Population Pyramid (2020 projection) Prepared by the UNC Institute on Aging Source of chart: UNC Chapel Hill, School of Social Work, CARES & NC Division of Aging