Download
1 / 18
180 likes | 302 Views
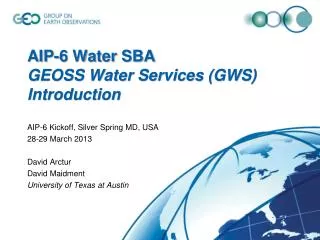
GEOSS Water Services Showcase Demos 2, 3, 4. AIP-6 Water SBA Team Proposals 17 May 2013. AIP-6 GEOSS Water Services Team. GEOSS Water Services . Showcase demo 2 : regional-national federations. Scenario / Use Case 2: .

E N D
GEOSS Water ServicesShowcase Demos 2, 3, 4 AIP-6 Water SBA Team Proposals 17 May 2013
GEOSS Water Services Showcase demo 2: regional-national federations
Scenario / Use Case 2: • National/local implementation / aggregation / federation of local data, maps, analysis • Data Providers: ISPRA/ARPA (Italy), NIWA/HRC (New Zealand)
Water data sharing in Italy A regional federation of 19 Regions, 2 Autonomous Provinces and the Italian National Institute for Environmental Protection and Research (ISPRA)
Italian National Water Agency (ISPRA)ARPA Emilia Romagna Regional Agency
A federated national\regional architecture HIS-Central in Rome Region 2 HydroServer Region 1 HydroServer …..
National Federation – New Zealand • Building a nationally accessible data platform to support regional and national reporting (enhancement of www.landandwater.co.nz
National Federation – New Zealand • 16 regional authorities and 1 national agency to coordinate and provide data • Current framework requires manual transfer of information and manual analysis protocols • National data Infrastructure built on agreed standards and schema’s, using WaterML2.0 as the common foundation • Interoperable framework across Authorities / Agencies using systems from a range of vendors (Kisters, Hilltop, 52 North, CUAHSI) • Engaging communities of interest across authorities and agencies to establish a data server infrastructure • Pilot will see participation from authorities and agencies through the middle of the country • Automated routines to provide analysis across authority and agency data will also be trialled.
GEOSS Water Services Showcase demo 3: Flood awareness & response
Towardsbetterearlywarningsystems Map Servers MeteorologicForecasts Cascade of Models Data Information Flow
SAT Comunitario SATTiempo Real ALCADÍAS GOB. REGIONALES COMUNIDAD COMUNIDAD
DominicanRepublic – anexample INDRHI (InstitutoNacional de RecursosHidráulicos) datos . . . . . . convertido a WaterML web services a BYU
GEOSS Water Services Showcase demo 4: Mitigating drought
Scenario / Use Case 4: • Drought awareness, forecasts, & notifications • Data Provider: NASA/NOAA, GLDAS (data rods) • Workflow steps: • Policy maker asks about drought based on some trigger (news broadcast or conference discussion). • Knowledge worker builds an information product based on available GEO resources: hydro locations, time series history, spatial analysis. • Knowledge worker publishes a water volume map service (or other relevant content service). • Knowledge worker combines the map service with other layers (such as the global hydro map) and shares this as an information product with the policy maker. • Policy maker interacts with the information product in simple app on tablet.
World Soil Moisture from the NASA Global Land Data Assimilation System (GLDAS) http://www.arcgis.com/home/webmap/viewer.html?webmap=7d6cefdf3f324b55b08c136654e91612 Charts show 3-hourly variation (37,000 values) of soil water content of the top 1m of soil from 2000 to 2012 Popup on point links to data and chart New Zealand A very wet region with little seasonality A much dryer region with strong seasonality A dryer region with significant seasonality