Download

1 / 20
200 likes | 319 Views
Generalised Resource Scarcity. We have to make choices urgently. 1908: The National Conservation Commission – growing concern of scarcity No stable population in immediate future – further ↑ in scarcity – especially in industrialised countries where per capita income is high

E N D
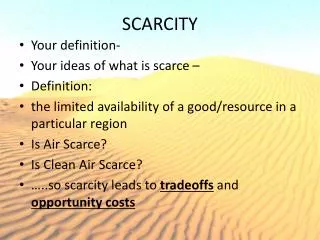
Generalised Resource Scarcity We have to make choices urgently.
1908: The National Conservation Commission – growing concern of scarcity • No stable population in immediate future – further ↑ in scarcity – especially in industrialised countries where per capita income is high • Automatic market corrections • Market & public policy imperfections • Rising demand - mines / wells exhausted • Is this going to continue? ..?...? Or is it an isolated pattern? • Desirability & inevitability of future economic growth – a larger debate
Should we worry? • Scarcity will affect quality of our lives – future generations will be affected too • There are 3 alternatives that defuse the pressures on environment assets that are caused by growth in population & income: • Role of exploration & discovery • Technical progress • Substitution for scarce resources by abundant ones
Exploration & Discovery: • Will explore until marginal discovery cost = marginal scarcity rent (MSR) • MSR is difference between price received & marginal cost of extraction = marginal benefit • Technological progress: • Reduces cost by finding new ways to extract, process & use the ore • Rate & type of technological progress are influenced by the degree of resource scarcity – as extraction cost increases → new opportunity to develop new technologies
Substitution: • The easier the substitution the smaller the impact of availability & costs- F1 & F2 are rt. Angled iso-quants – F2<F1 – S1: possibility for substitution – tech used by S1 & F1 are diff - …. S1 F1 F2 X3 X1 O1 X2 Substitution possible O2 O Y2 Y1
Some factors like population & income, may the likelihood of the scarcity while these three (exploration & discovery, technological progress, input substitution) mitigate the seriousness of scarcity. • To determine which set of factors dominates, we must examine the evidence.
Detecting Resource Scarcity • Selecting means to detect scarcity : 1st step in assessing the seriousness of scarcity – criterion for ideal indicators: • Foresight: • Comparability • computability
Applying the Criteria • The physical indicators: • Resource Prices (RPs): efficient RPs maximise net benefit to the society – market prices may not be efficient • Scarcity Rent (SR) : payment accruing to a resource owner when user cost is +ve – if future didn’t matter there would be no scarcity rent – can be used as indicator for renewable & depletable resources – SR for all open access resources is zero - SR ↑ availability of resource
Marginal Discovery Cost (MDC): SR is not observable directly ∴ MDC if can be observed is = MSRent – unluckily very little information on MDC is available ∴ not of much use • Marginal Extraction Cost (MEC): With given technology for extraction as lower grades are extracted MEC is expected to - MEC is a signal of the amount of sacrifice needed to procure each unit of resource – can approximate unit extraction cost with available information – Harold Barnett & Chandler Morse (1963): Ci = (αi Li+ βiKi) / Qi
Evidence on Resource Scarcity • Different studies to understand degree of scarcity – different approaches – different conclusions • Physical indicators: reserve-to-use ratios – In 1970 many metals had a ratio of less than 30 yrs – But we have not exhausted those yet • Demand side: key is in ability to substitute renewable for depletable natural resources – to assess potential degree of substitution between natural resources & other commodities is to estimate a construct known as ‘elasticity of substitution’ (б)
Supply side: studied by Goeller & Weinberg (1978) – tried to find current & future availability – computed static reserve indices for each substance - phosphorus: will run out 1st will last another 1300 yrs – other resources for millions of years – 2 main conclusions: • except phosphorus, a few trace elements for agriculture & energy fossil fuel, there is virtually unlimited supply • Transition away from these limited resources will mean a relatively little loss in standards of living – maximum: double prices of current level
In reality we are somewhere between pessimism of reserve-to-use ration & optimism of Goeller and Weinberg forecast • Skinner suggested that a different distribution may be the truth – 3 groups • Skinner hypothesis implies that as we mine lower grades of geo-chemically scarce resources we shall find less lower grade ore available over some considerable range of grades
A model of future market in US for copper • Rate of extraction rapidly over 100 yrs – extraction peak at 2100 – peak extractn rate 8 times of current rate • Will exhaust by 2070 – then from copper rock - 0.05% maximum grade - expensive but no longer scarce • In the LR other substitutes • Recycling – big business • Price drastic over next century • Price of copper 10 fold – cost of copper related services by 10 fold
Economic Indicators • Extraction cost: Barnett & Morse’s empirical evaluations – found no evidence of scarcity except forestry – have given 4 explanations for absence of any evidence of scarcity • Historically, as higher grade resources exhausted, lower grade became available • Users shifted to less scarce resource • As price ↑ incentive to explore • Technological change → ↓ cost of extraction ∴ Optimistic future
Scarcity due to growth is foregone conclusion – discoveries have possibilities of substitution - to unimaginable degree & man has many alternatives available • Scepticism may be is more appropriate for such conclusions – Barnett & Morse fail to consider energy costs in measuring cost of extraction – whether scarcity is taking place depends on not only availability & cost of labour & capital but also on scarcity of energy
Study by Johnson, Bell & Barnett extended analysis on American unit extraction costs (1980) and found that • B-M findings of scarcity in forestry was reversed in 1958-70 period • Out of 15 agricultural commodities all had falling unit extraction costs during 1958-72 period • Of 11 mineral & fuel commodity groups studied all had extraction cost • Unit extraction cost have in commercial fishing from 1962 – only case of scarcity
Studies of resource price trends • Scarcity of resources then their prices should faster than other goods • Today prices of food grains & food items are faster than other prices mainly due to less land available for farming • Slade Margaret (1982) investigated the prices that suggested that “if scarcity is measured by relative prices, the evidence indicates that non-renewable natural resources commodities are becoming more scarce.”
Discovery cost: Fisher (1981) compared with average discovery cost in US for oil & gas for 1950-71. In 1999 -around $16 a barrel. July 2008, peaked at $147 a barrel. In the months that followed, as fears of a global recession grew, prices plunged to the $75 a barrel range. Now? Now price has changed for a different reason all together – difficult to estimate marginal discovery costs because the magnitude of any given year’s discoveries remain unknown
Juxtaposing Alternative Measures: No single indicator universally dominates all others better to use several indicators, deriving information
To conclude • Goeller & Weinberg’s work makes it clear that we have abundant resources • Historically no evidence of scarcity except for oil & gas • Our ability to detect scarcity is limited • We are unable to incorporate various environmental costs of increasing resource use • If history doesn’t indicate scarcity, doesn’t mean that it will not happen in future.