Download
1 / 24
250 likes | 424 Views
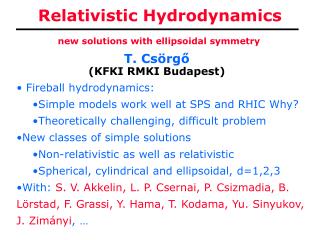
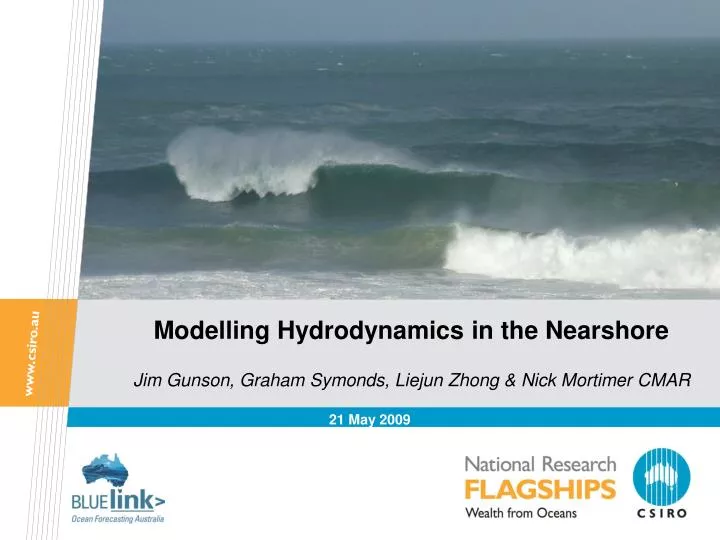
Modelling Hydrodynamics in the Nearshore. Jim Gunson, Graham Symonds, Liejun Zhong & Nick Mortimer CMAR. 21 May 2009. Setting.

E N D
Modelling Hydrodynamics in the Nearshore Jim Gunson, Graham Symonds, Liejun Zhong & Nick Mortimer CMAR 21 May 2009
Setting Purpose:- Operational prediction of nearshore conditions (Bluelink)- Better understanding of surf-zone circulation.Outline of talk: - Overview of nearshore hydrodynamic modelling - Marmion lagoon- Secret Harbour beach- Linkages with other models.
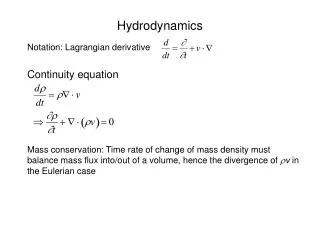
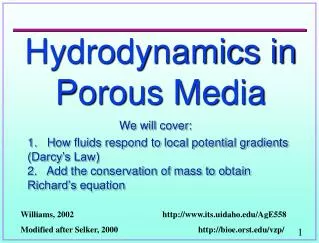
Background When incoming waves break in the surf zone, they can drive currents. Need model that couples a wave model to a current model. Critical elements:- Knowledge of boundary conditions- Knowledge of bathymetry- Computational costWave model: - Conservation of wave action (SWAN, Xbeach) phase-averaging.- Mild-slope equation (Ref-Dif), phase-resolving.Circulation model: - 2D (shallow-water equations): Storm-surge models, Curvcirc, Xbeach.- 3D (Navier-Stokes equations): Ocean models, PolCOMMS, ROMS, SHOC.
Marmion Lagoon habitat distribution Marine habitat types correspond to wave energy experienced • Algae in high energy • Seagrass in low energy Bare sand Seagrass Low relief reef Algae dominated Benthic habitat Mean wave height
Lagoon Measurement Program • From July 2007 to May 2008 • An area of order 5km x 10km • Reef lines of 1~3m depth • About 10m deep inside lagoon • Measurements of wave, current, pressure, T, S, Chlorophyll, nitrate, etc RDIN AQ1 AQ2 RDIS
CTD Survey - 6/2/2008 • High nutrient levels over reef • Use the numerical model to identify the possible sources of nutrient over the reefs
Wind, wave and currents during July 2007 • Southerly wind component at all times • Low variation in wave direction • Low correlation between currents and wind
Marmion Lagoon Region • Complex bathymetry with depth change of 5-10m over several hundred meters across a reef. Deep channels exist between reefs in reef lines. • Weak stratification although there are seasonal variations of temperature and salinity • Weak tidal currents but tidal sea level may be important in terms of wave breaking over the reefs
Marmion Lagoon Model • ROMS Configuration • Physical domain, 10km x 30km • Grid size, 120 x 240 x 8 • Horizontal resolution, 50~150m • Tidal forcing from 8 tidal constituents K1, O1, P1, Q1, M2, S2, N2 and K2 whose harmonic constants are derived from TPXO6 • surface momentum, heat and moisture fluxes calculated from bulk parameterizations • Wave data from AWAC site
ubar, vbar, h Dwave, Hwave, Lwave, Pwave_top, Pwave_bot, Ub_swan, Wave_dissip Dynamic feedback between ROMS & SWAN
Wind, wave and currents during July 2007 • Southerly wind component at all times • Low variation in wave direction • Low correlation between currents and wind
Model-data comparison OBS No coupling Two-way coupling
Wind, wave and currents during July 2007 • Southerly wind component at all times • Low variation in wave direction • Low correlation between currents and wind
Model-data comparison OBS No coupling Two-way coupling
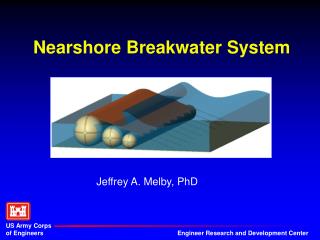
Nearshore Experiment BLUElink II Nearshore Experiment Secret Harbour, WA Feb 9 to Mar 6, 2009 Aim: To measure wave driven, alongshore currents and compare with numerical simulations using selected models.
Instrument array (not to scale) Radar 10 Shore break Surf zone Depth (m) 0 SBE26-1 -1 VEC2 VEC3 VEC1 -2 VEC4 SBE26-2 -10 AWAC 0 50 100 1000 Nortek Vector (u,v,w,P,T) Cross-shore distance (m) Seabird SBE26 (P,T) Nortek AWAC (u(z),v(z),z)
Wind and wave observations Sea-breeze cycle
Secret Harbour – model domain Choice:- Extends over instruments- Resolve surf-zone- Rotated grid
Secret Harbour – NearCoM, preliminary run - Model domain: 1150m x 1450m, Δx=Δy=5m- Forced by swell (Hs=.8m, Tp=10s, Dir=10º) on seaward boundary.
Linkages with other models Biogeochemistry Hydrodynamic variables of interest to BGC:- Wave orbital velocity- Wave-induced vertical mixing- Bottom pressure variations- Bottom velocity- Stokes drift- Tidal signal (local amplitude and phase)
Linkages with other models Morphodynamics Capabilities:- NearCoM- Xbeach- Scouring- Sand-bar formation- Changing sea-level
Linkages with other models Morphodynamics Challenges:- Rebuilding a beach- 3D circulation- Long time-scales with short time-scales- Knowledge of bathymetry crucial- Data assimiliation / sensitivity studies